Technical Analysis of BLKC 2024-05-10
Overview:
In analyzing the technical indicators for BLKC over the last 5 days, we will delve into the trend, momentum, volatility, and volume indicators to provide a comprehensive outlook on the possible stock price movement. By examining these key factors, we aim to offer valuable insights and predictions for the upcoming days.
Trend Analysis:
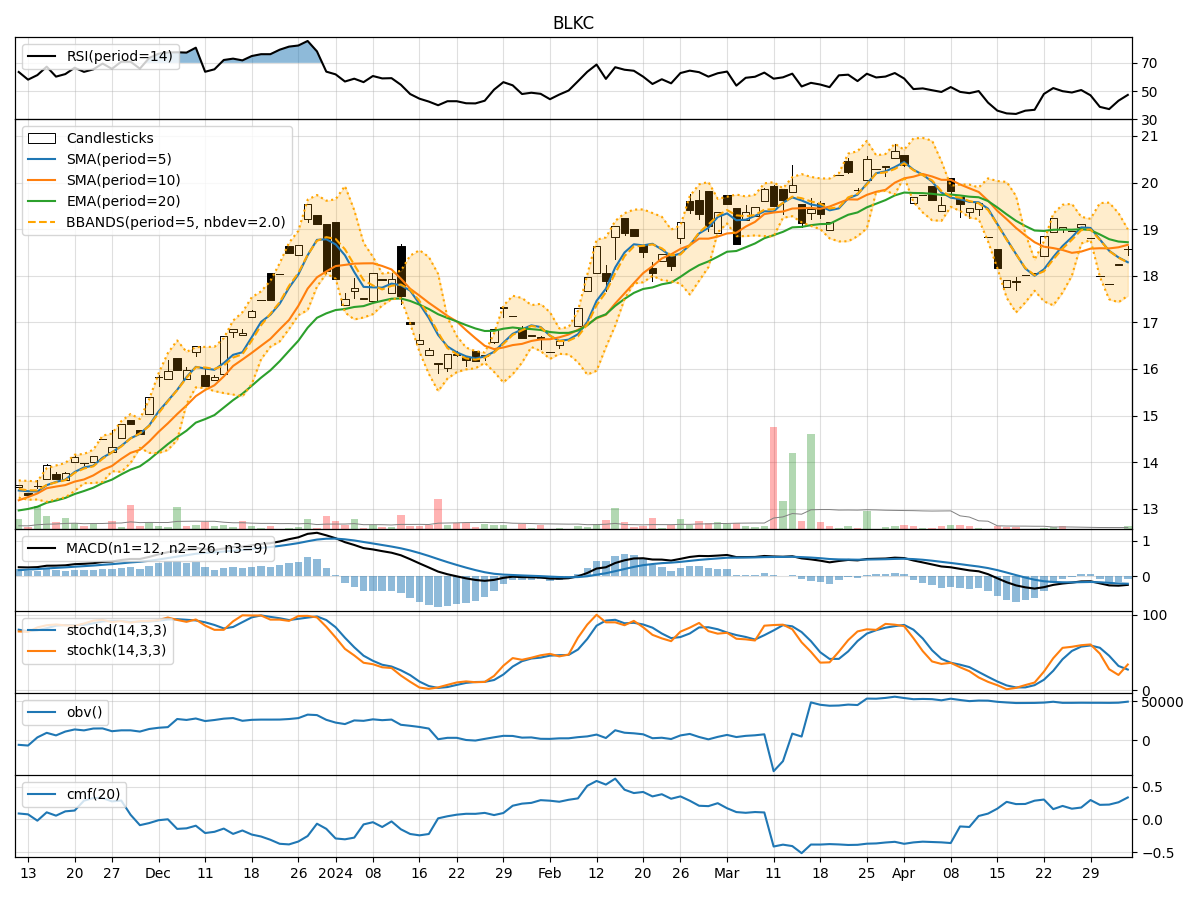
- Moving Averages (MA): The 5-day Moving Average (MA) has been consistently above the Simple Moving Average (SMA) and Exponential Moving Average (EMA), indicating a short-term bullish trend.
- MACD: The Moving Average Convergence Divergence (MACD) has been negative but showing signs of convergence towards the signal line, suggesting a potential reversal in the bearish momentum.
Momentum Analysis:
- RSI: The Relative Strength Index (RSI) has been fluctuating around the neutral zone, indicating indecision in the market.
- Stochastic Oscillator: Both %K and %D have been declining, signaling a potential bearish momentum.
- Williams %R: The Williams %R is in oversold territory, suggesting a possible reversal to the upside.
Volatility Analysis:
- Bollinger Bands (BB): The stock price has been trading within the Bollinger Bands, with the bands narrowing, indicating decreasing volatility.
- Bollinger %B: The %B indicator is hovering around the middle range, reflecting a neutral stance in terms of volatility.
Volume Analysis:
- On-Balance Volume (OBV): The OBV has been relatively stable, indicating a balance between buying and selling pressure.
- Chaikin Money Flow (CMF): The CMF has been positive but trending downwards, suggesting a potential decrease in buying pressure.
Key Observations:
- The trend indicators point towards a short-term bullish bias, supported by the moving averages.
- Momentum indicators show mixed signals, with RSI indicating neutrality, Stochastic Oscillator hinting at bearish momentum, and Williams %R signaling a possible reversal.
- Volatility is decreasing as per the Bollinger Bands, indicating a potential period of consolidation.
- Volume indicators suggest a balance between buying and selling pressure, with a slight decrease in buying momentum.
Conclusion:
Based on the analysis of the technical indicators, the next few days for BLKC could see sideways movement with a slight bullish bias. Traders should monitor the Stochastic Oscillator for potential bearish signals and the Williams %R for a possible reversal to the upside. Additionally, keeping an eye on the OBV and CMF for any shifts in buying pressure would be crucial in making informed trading decisions.