Technical Analysis of BLLD 2024-05-10
Overview:
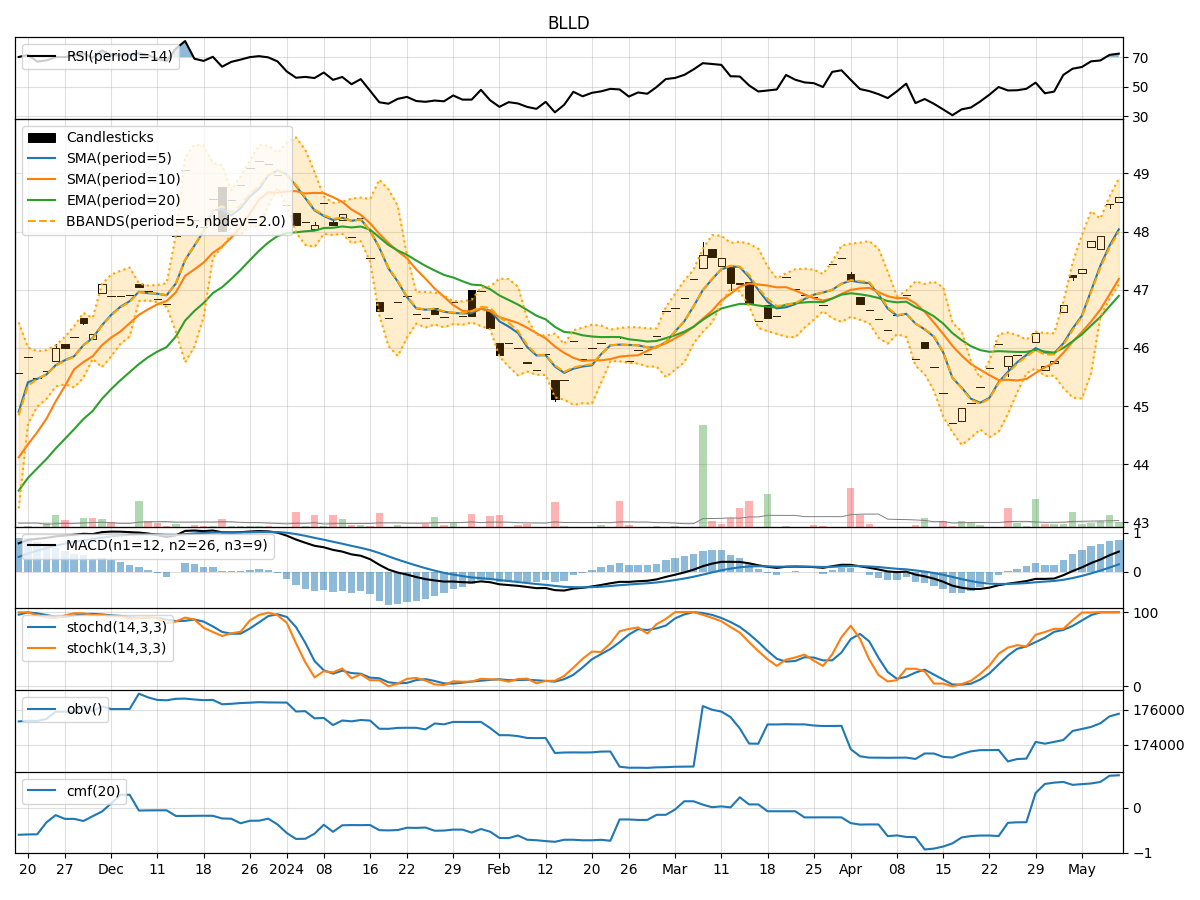
In analyzing the technical indicators for BLLD over the last 5 days, we will delve into the trend, momentum, volatility, and volume indicators to provide a comprehensive outlook on the possible stock price movement in the coming days. By examining these key indicators, we aim to offer valuable insights and predictions for potential investors.
Trend Indicators:
- Moving Averages (MA): The moving averages have been showing a consistent uptrend over the last 5 days, with the closing price consistently above the short-term moving averages.
- MACD: The MACD indicator has been positive and increasing, indicating a strengthening bullish momentum.
- RSI: The RSI has been in the overbought territory, suggesting a strong bullish sentiment in the market.
Momentum Indicators:
- Stochastic Oscillator: The stochastic oscillator has been consistently in the overbought region, indicating a strong buying pressure.
- Williams %R (WillR): The Williams %R has been hovering around the oversold region, suggesting a potential reversal in the short term.
Volatility Indicators:
- Bollinger Bands (BB): The Bollinger Bands have been widening, indicating increased volatility in the stock price.
- Average True Range (ATR): The ATR has been relatively stable, suggesting consistent price movements without significant spikes.
Volume Indicators:
- On-Balance Volume (OBV): The OBV has been steadily increasing, reflecting strong buying volume in the stock.
- Chaikin Money Flow (CMF): The CMF has been positive, indicating a healthy inflow of money into the stock.
Key Observations and Opinions:
- Trend: The trend indicators suggest a strong bullish momentum in the stock, supported by the moving averages and MACD.
- Momentum: The momentum indicators indicate a high buying pressure, with the stochastic oscillator in the overbought region.
- Volatility: The widening Bollinger Bands suggest increased volatility, which could lead to larger price swings.
- Volume: The volume indicators show a consistent increase in buying volume, supporting the bullish sentiment in the stock.
Conclusion:
Based on the analysis of the technical indicators, the stock is likely to continue its upward movement in the coming days. The strong bullish trend, high buying pressure, and positive volume indicators all point towards further price appreciation. Investors may consider buying or holding positions in BLLD, as the technical analysis signals a bullish outlook for the stock.