Technical Analysis of BMAY 2024-05-10
Overview:
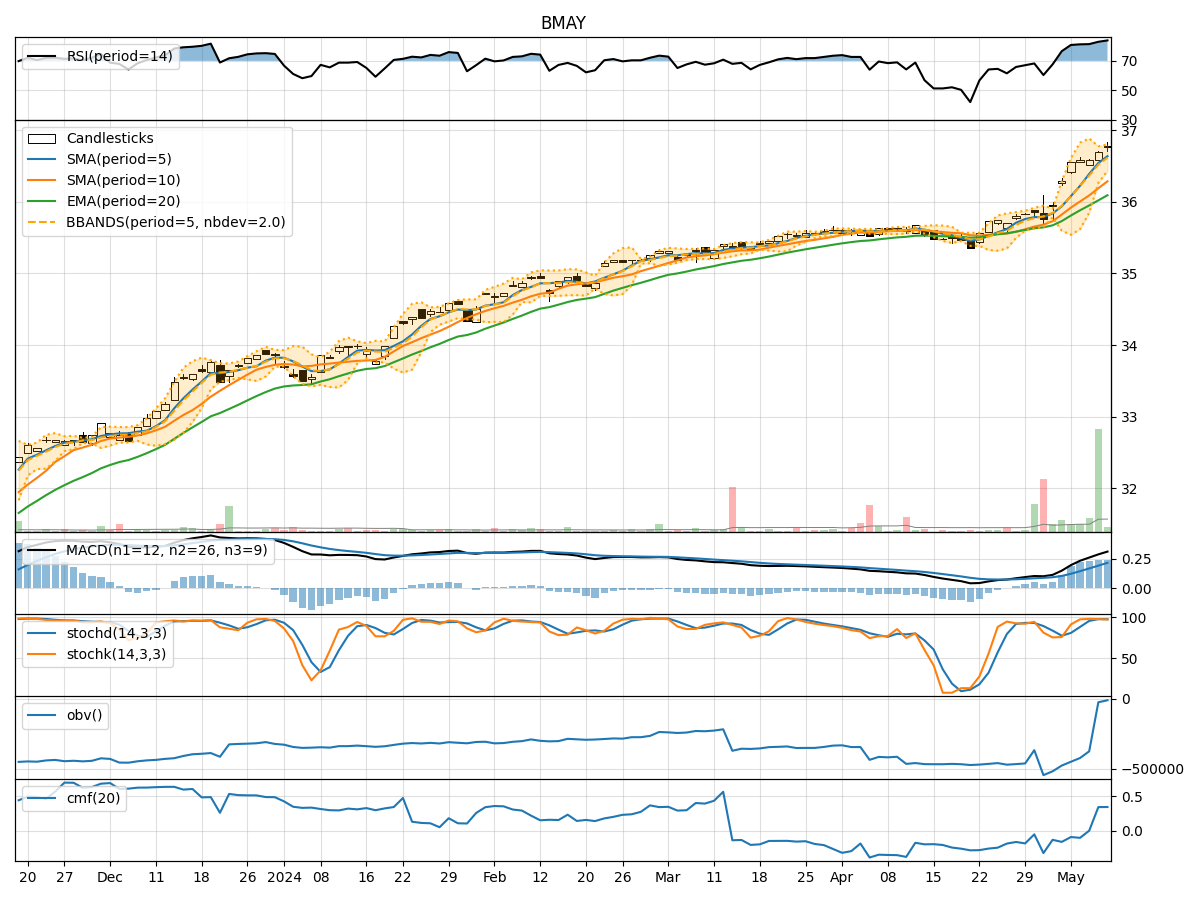
In analyzing the technical indicators for BMAY stock over the last 5 days, we will delve into the trends, momentum, volatility, and volume aspects to provide a comprehensive outlook on the possible stock price movement in the coming days. By examining key indicators such as moving averages, MACD, RSI, Bollinger Bands, and OBV, we aim to offer valuable insights and predictions for informed decision-making.
Trend Analysis:
- Moving Averages (MA): The 5-day MA has been consistently above the 10-day SMA, indicating a short-term bullish trend.
- MACD: The MACD line has been trending upwards, with the MACD histogram showing positive values, suggesting bullish momentum.
Momentum Analysis:
- RSI: The RSI values have been consistently above 70, indicating overbought conditions but also strong bullish momentum.
- Stochastic Oscillator: Both %K and %D values have been in the overbought territory, suggesting a strong upward momentum.
Volatility Analysis:
- Bollinger Bands (BB): The stock price has been trading near the upper Bollinger Band, indicating high volatility and potential overbought conditions.
Volume Analysis:
- On-Balance Volume (OBV): The OBV has shown positive accumulation, indicating buying pressure and potential bullish sentiment.
Key Observations:
- The stock is currently in a strong bullish trend based on moving averages and MACD.
- Momentum indicators like RSI and Stochastic Oscillator suggest overbought conditions but also strong upward momentum.
- Volatility is high as the stock price is near the upper Bollinger Band, indicating potential for a pullback.
- Positive OBV values indicate buying pressure and accumulation of the stock.
Conclusion:
Based on the technical analysis of trend, momentum, volatility, and volume indicators, the stock is likely to continue its upward movement in the short term. However, caution is advised as the stock is in overbought territory, and a potential pullback or consolidation phase may occur due to high volatility. Traders should closely monitor the price action and key support levels for any signs of reversal. Overall, the outlook remains bullish in the near future, but with a need for vigilance towards potential corrections.