Technical Analysis of BMED 2024-05-10
Overview:
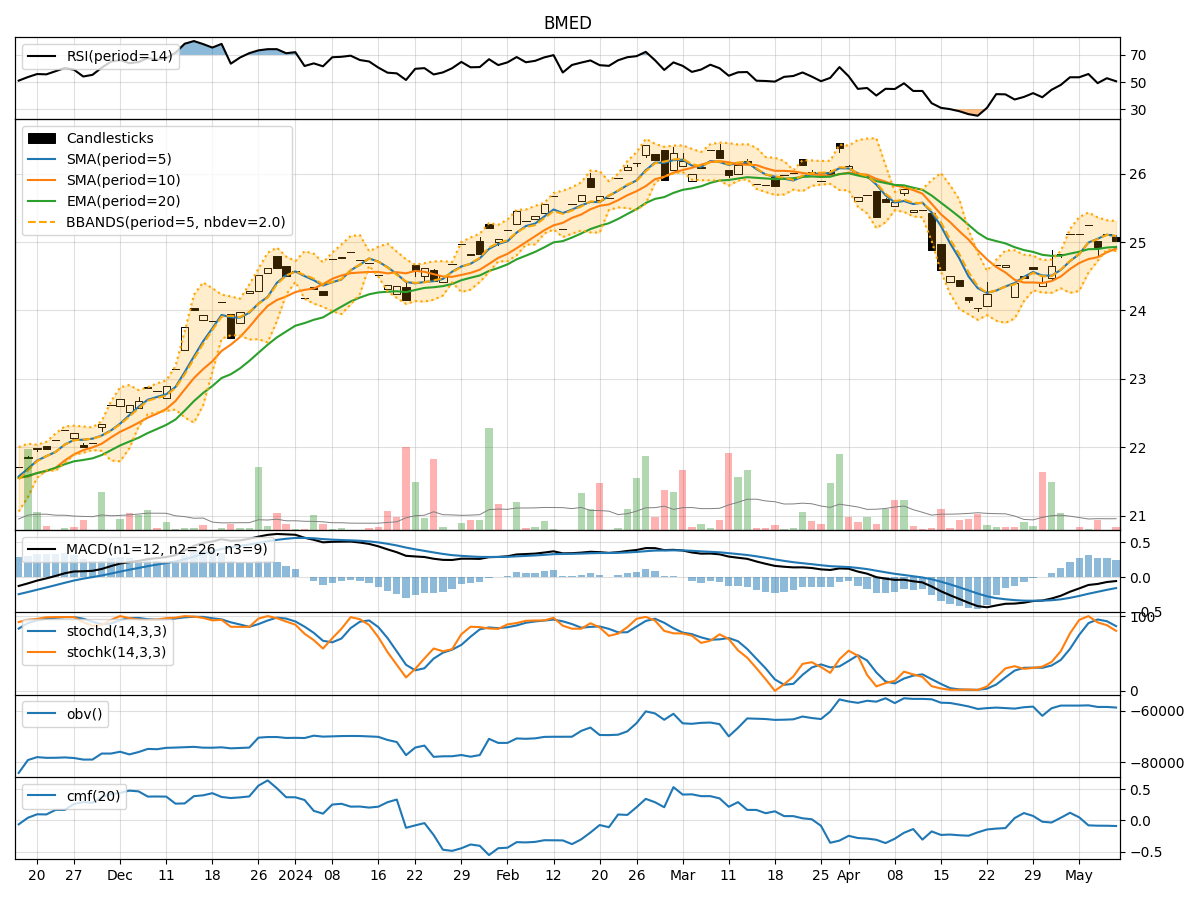
In analyzing the technical indicators for BMED over the last 5 days, we will delve into the trend, momentum, volatility, and volume indicators to provide a comprehensive outlook on the possible stock price movement. By examining these key aspects, we aim to offer valuable insights and predictions for the upcoming days.
Trend Indicators:
- Moving Averages (MA): The 5-day MA has been consistently above the closing prices, indicating a potential bullish trend.
- MACD: The MACD line has been below the signal line but showing signs of convergence, suggesting a possible trend reversal.
- RSI: The RSI values have been fluctuating around the neutral zone, indicating indecision in the market sentiment.
Momentum Indicators:
- Stochastic Oscillator: The stochastic indicators have been gradually decreasing, signaling a potential bearish momentum.
- Williams %R: The Williams %R values have been hovering in the oversold territory, indicating a possible reversal in the near future.
Volatility Indicators:
- Bollinger Bands: The Bollinger Bands have been narrowing, suggesting a decrease in volatility and a potential consolidation phase.
- Average True Range (ATR): The ATR values have been relatively stable, indicating a lack of significant price movements.
Volume Indicators:
- On-Balance Volume (OBV): The OBV values have been fluctuating, indicating mixed buying and selling pressure.
- Chaikin Money Flow (CMF): The CMF values have been negative, suggesting a bearish money flow in the market.
Key Observations and Opinions:
- Trend: The trend indicators show a mixed outlook with potential for a bullish reversal.
- Momentum: The momentum indicators suggest a bearish bias in the short term.
- Volatility: Volatility indicators point towards a period of consolidation and reduced price fluctuations.
- Volume: Volume indicators reflect a lack of strong buying or selling pressure in the market.
Conclusion:
Based on the analysis of the technical indicators, the next few days for BMED stock price movement could see sideways consolidation with a slight bearish bias. Traders should exercise caution and closely monitor key support and resistance levels for potential entry or exit points. It is advisable to wait for clearer signals or confirmation of a new trend direction before making significant trading decisions.