Technical Analysis of BMVP 2024-05-10
Overview:
In analyzing the provided Technical Analysis (TA) data for the last 5 days, we will delve into the trend, momentum, volatility, and volume indicators to forecast the possible stock price movement for the next few days. By examining these key indicators, we aim to provide a comprehensive and insightful prediction backed by data-driven analysis.
Trend Indicators:
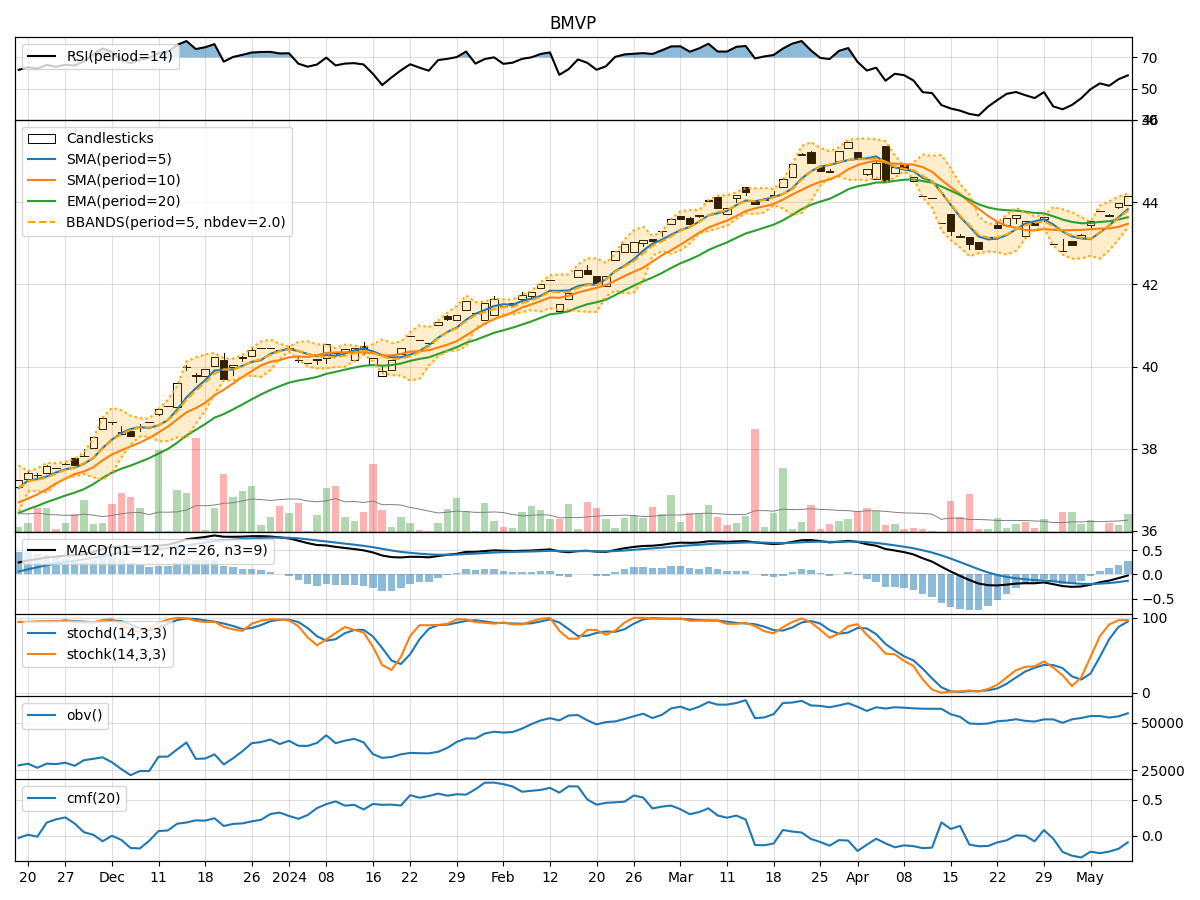
- Moving Averages (MA): The 5-day Moving Average (MA) has been trending above the Simple Moving Average (SMA) and Exponential Moving Average (EMA), indicating a short-term bullish trend.
- MACD: The Moving Average Convergence Divergence (MACD) has been negative but showing signs of convergence towards the signal line, suggesting a potential reversal in the bearish momentum.
- MACD Histogram: The MACD Histogram has been gradually increasing, indicating a strengthening bullish momentum.
Momentum Indicators:
- RSI: The Relative Strength Index (RSI) has been fluctuating around the neutral level, indicating a lack of strong momentum in either direction.
- Stochastic Oscillator: Both %K and %D have been in the overbought zone, suggesting a potential reversal or consolidation phase.
- Williams %R: The Williams %R is in the oversold territory, indicating a possible bullish reversal.
Volatility Indicators:
- Bollinger Bands (BB): The stock price has been trading within the Bollinger Bands, with the bands narrowing, suggesting a period of low volatility.
- Bollinger %B: The %B indicator is hovering around the middle range, indicating a balanced market sentiment.
Volume Indicators:
- On-Balance Volume (OBV): The OBV has been fluctuating, indicating indecision among market participants.
- Chaikin Money Flow (CMF): The CMF has been negative, suggesting a net outflow of money from the stock.
Key Observations and Opinions:
- Trend: The short-term trend is bullish based on moving averages, but the MACD signals a potential reversal.
- Momentum: Mixed signals from RSI and Stochastic Oscillator indicate a lack of clear direction in momentum.
- Volatility: Low volatility as indicated by the narrowing Bollinger Bands suggests a period of consolidation.
- Volume: The OBV and CMF indicate a lack of strong buying or selling pressure.
Conclusion:
Based on the analysis of the technical indicators, the stock is likely to experience sideways movement or consolidation in the next few days. The conflicting signals from trend, momentum, volatility, and volume indicators suggest a period of indecision among market participants. Traders may consider adopting a neutral stance or wait for clearer signals before making significant trading decisions.