Technical Analysis of BNDC 2024-05-10
Overview:
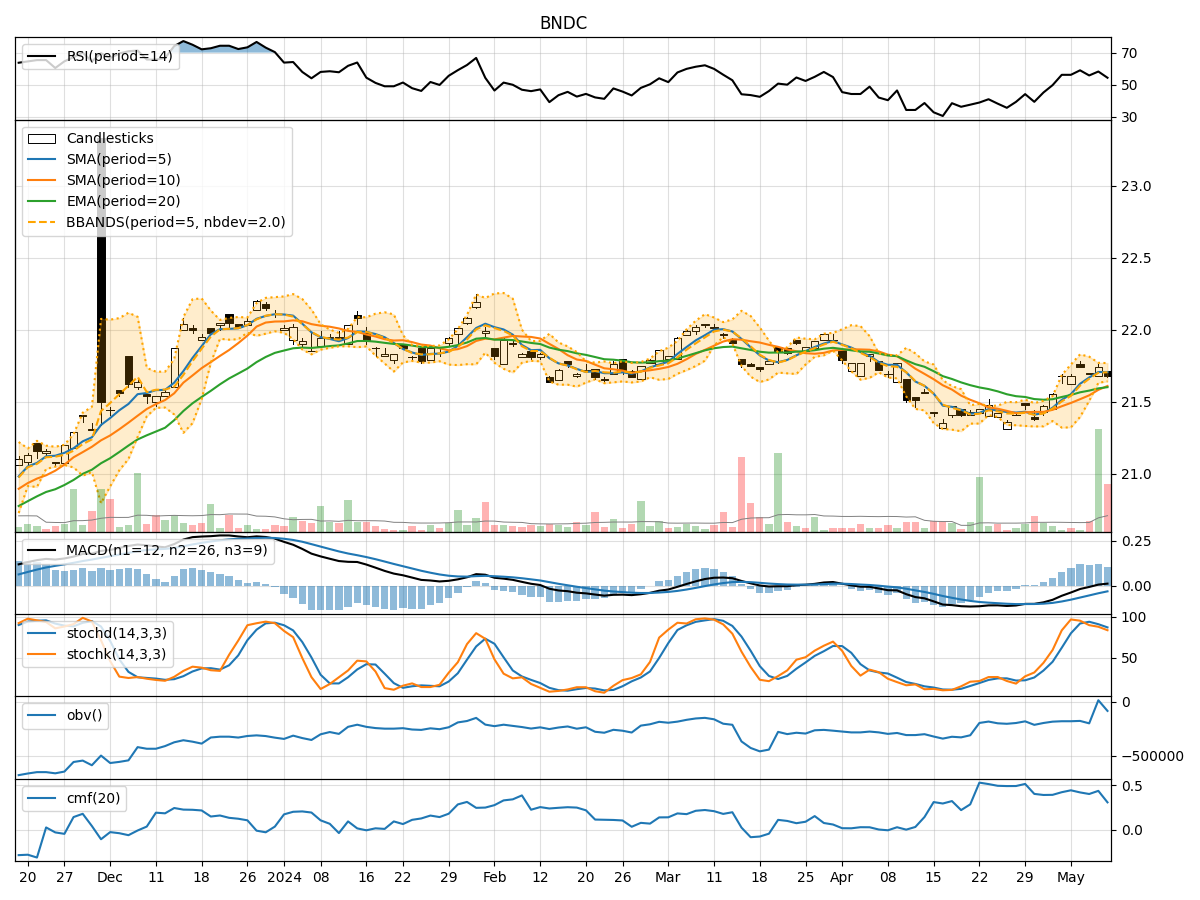
In analyzing the technical indicators for BNDC over the last 5 days, we will delve into the trend, momentum, volatility, and volume indicators to provide a comprehensive outlook on the possible stock price movement in the coming days.
Trend Analysis:
- Moving Averages (MA): The 5-day Moving Average (MA) has been relatively stable around the current price, indicating a neutral trend.
- MACD: The Moving Average Convergence Divergence (MACD) has shown a slight positive trend, with the MACD line crossing above the signal line, suggesting a potential bullish momentum.
- RSI: The Relative Strength Index (RSI) has been fluctuating around the neutral zone, indicating indecision in the market sentiment.
Momentum Analysis:
- Stochastic Oscillator: The Stochastic Oscillator has been gradually decreasing, signaling a potential bearish momentum.
- Williams %R: The Williams %R indicator is in the oversold territory, suggesting a possible reversal in the short term.
Volatility Analysis:
- Bollinger Bands: The Bollinger Bands have been narrowing, indicating decreasing volatility and a potential breakout in the near future.
Volume Analysis:
- On-Balance Volume (OBV): The OBV has shown mixed signals, with fluctuations in volume accumulation.
- Chaikin Money Flow (CMF): The CMF has been relatively stable, indicating a neutral money flow trend.
Key Observations:
- The trend indicators suggest a neutral to slightly bullish outlook.
- Momentum indicators point towards a potential bearish momentum in the short term.
- Volatility indicators indicate a potential breakout due to decreasing volatility.
- Volume indicators show mixed signals with no clear direction in volume accumulation.
Conclusion:
Based on the analysis of the technical indicators, the next few days' possible stock price movement for BNDC is likely to experience a period of consolidation. The conflicting signals from the trend, momentum, volatility, and volume indicators suggest a lack of clear direction in the immediate future. Traders and investors should exercise caution and closely monitor key support and resistance levels for potential entry or exit points.