Technical Analysis of BNDI 2024-05-10
Overview:
In analyzing the technical indicators for BNDI over the last 5 days, we will delve into the trend, momentum, volatility, and volume indicators to provide a comprehensive outlook on the possible stock price movement in the coming days. By examining these key aspects, we aim to offer valuable insights and recommendations for potential investors.
Trend Indicators:
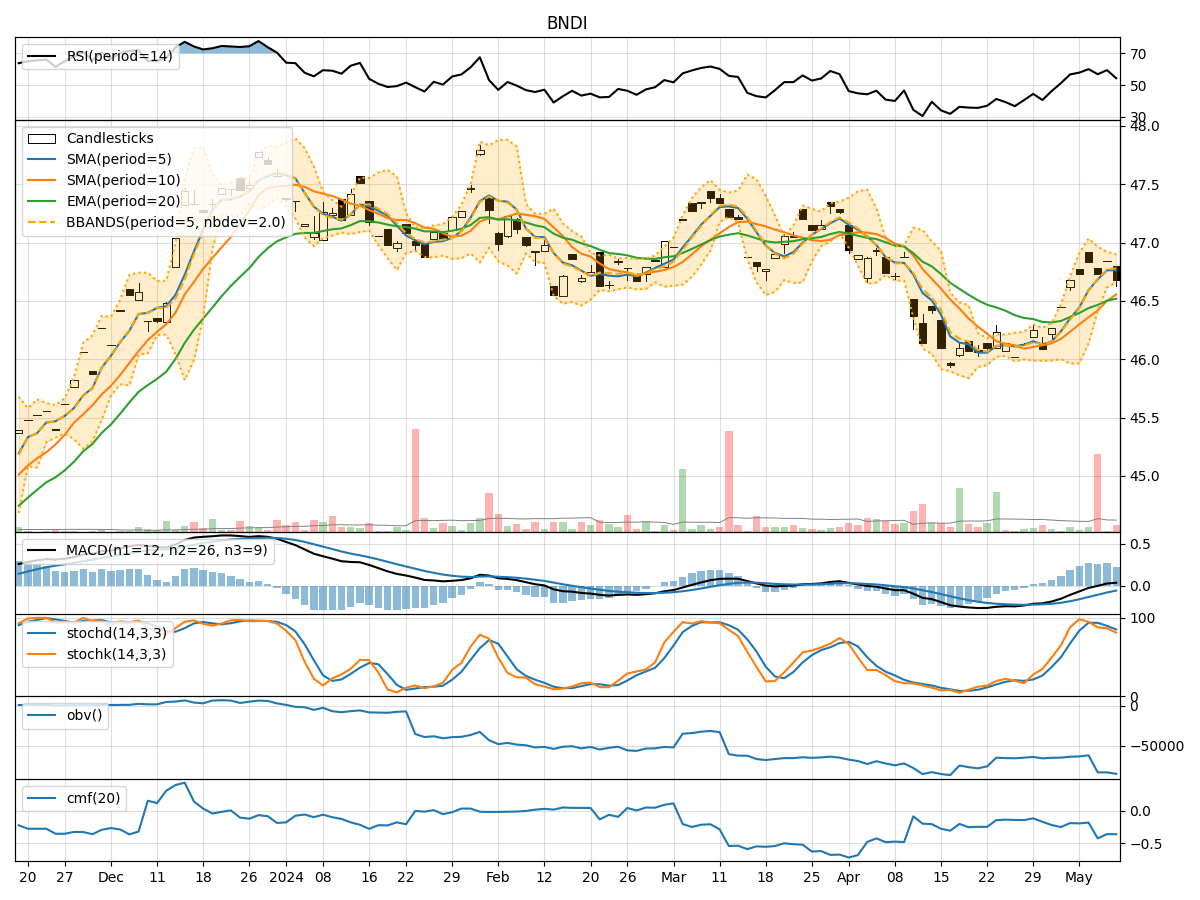
- Moving Averages (MA): The 5-day MA has been consistently above the 10-day SMA, indicating a short-term bullish trend. The EMA(20) has shown a slight upward trend, suggesting positive momentum.
- MACD: The MACD line has been above the signal line for the past few days, indicating a bullish momentum in the stock price.
- RSI: The RSI has been fluctuating around the 50 level, indicating a neutral stance in terms of momentum.
Momentum Indicators:
- Stochastic Oscillator: The stochastic oscillator has been gradually decreasing, suggesting a potential reversal in the short-term momentum.
- Williams %R: The Williams %R indicator has been in oversold territory, indicating a possible buying opportunity.
Volatility Indicators:
- Bollinger Bands: The Bollinger Bands have been narrowing, indicating decreasing volatility in the stock price.
- BB% (Bollinger Band %B): The BB% has been hovering around the midline, suggesting a period of consolidation.
Volume Indicators:
- On-Balance Volume (OBV): The OBV has been declining, indicating a potential distribution phase in the stock.
- Chaikin Money Flow (CMF): The CMF has been negative, suggesting selling pressure in the stock.
Key Observations and Opinions:
- Trend: The trend indicators suggest a short-term bullish bias in the stock price.
- Momentum: The momentum indicators show a mixed signal, with a potential reversal in the short-term momentum.
- Volatility: Volatility has been decreasing, indicating a period of consolidation.
- Volume: The volume indicators point towards a distribution phase with selling pressure.
Conclusion:
Based on the analysis of the technical indicators, the next few days' possible stock price movement for BNDI is likely to be sideways with a slight bearish bias. Investors should exercise caution and closely monitor the price action for any potential trend reversal signals. It is advisable to wait for confirmation from key indicators before making any significant trading decisions.