Technical Analysis of BNDX 2024-05-10
Overview:
In analyzing the technical indicators for BNDX over the last 5 days, we will delve into the trend, momentum, volatility, and volume indicators to provide a comprehensive outlook on the possible stock price movement in the coming days. By examining these key aspects, we aim to offer valuable insights and predictions to guide your investment decisions.
Trend Analysis:
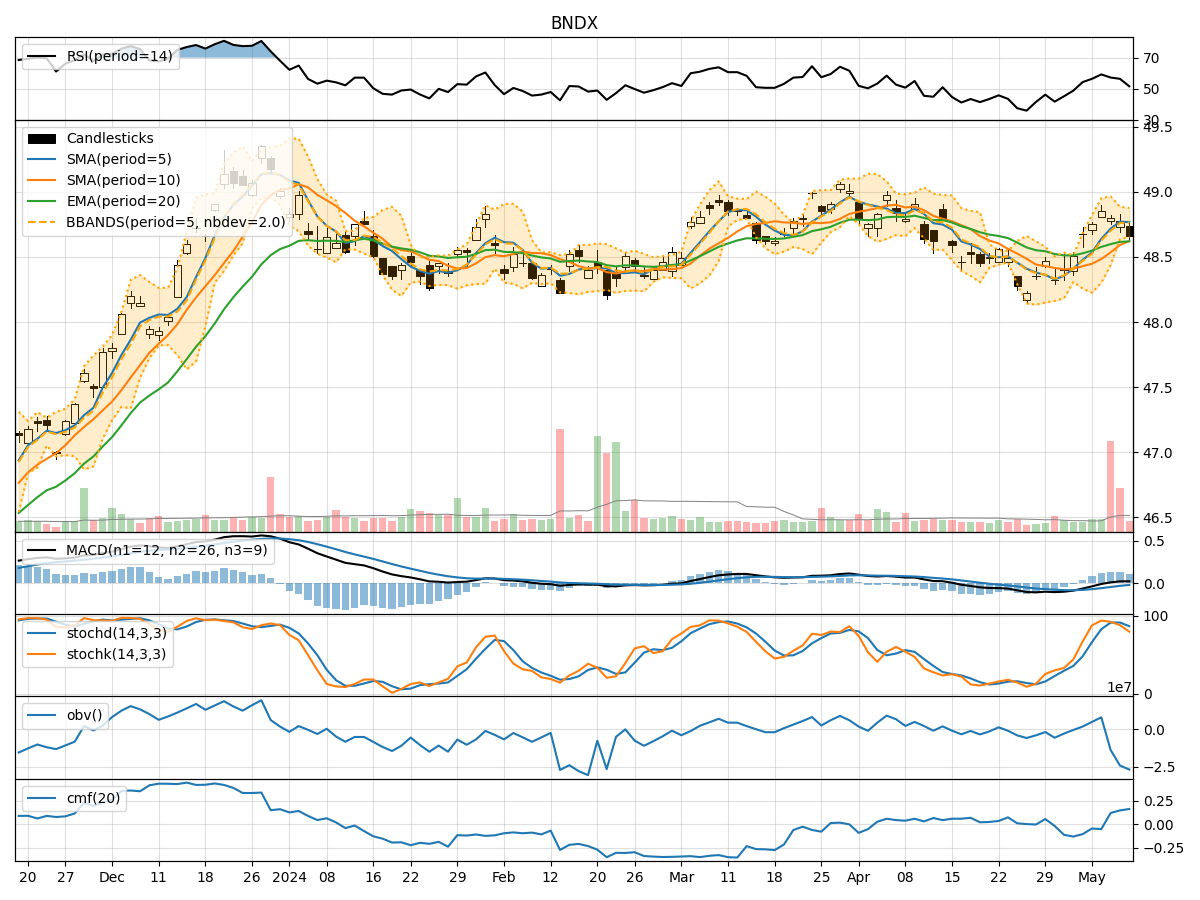
- Moving Averages (MA): The 5-day MA has been showing a slight upward trend, indicating a positive momentum in the short term.
- MACD: The MACD line has been consistently above the signal line, suggesting a bullish trend.
- RSI: The RSI is in the neutral zone, indicating a balanced market sentiment.
Momentum Analysis:
- Stochastic Oscillator: The Stochastic indicators have been gradually decreasing, signaling a potential reversal in momentum.
- Williams %R: The Williams %R is in the oversold territory, indicating a possible buying opportunity.
Volatility Analysis:
- Bollinger Bands (BB): The Bollinger Bands have been narrowing, suggesting a decrease in volatility and a potential breakout in the near future.
- Average True Range (ATR): The ATR has been relatively stable, indicating consistent price movements.
Volume Analysis:
- On-Balance Volume (OBV): The OBV has been fluctuating, reflecting indecision among investors.
- Chaikin Money Flow (CMF): The CMF is positive, indicating buying pressure in the market.
Key Observations:
- The trend indicators suggest a bullish sentiment in the short term.
- Momentum indicators show a potential reversal in momentum.
- Volatility indicators point towards a possible breakout.
- Volume indicators reflect mixed signals with fluctuating OBV and positive CMF.
Conclusion:
Based on the analysis of the technical indicators, the next few days' possible stock price movement for BNDX is likely to be bullish in the short term. Investors may consider taking advantage of the potential buying opportunity indicated by the oversold Williams %R and the positive trend shown by the moving averages and MACD. However, it is essential to monitor the Stochastic indicators for any signs of a reversal in momentum and to be prepared for increased volatility as indicated by the narrowing Bollinger Bands. Overall, a cautious but optimistic approach is recommended for trading BNDX in the coming days.