Technical Analysis of BNGE 2024-05-10
Overview:
In analyzing the technical indicators for BNGE over the last 5 days, we will delve into the trend, momentum, volatility, and volume indicators to provide a comprehensive outlook on the possible stock price movement in the coming days. By examining these key aspects, we aim to offer valuable insights and predictions to guide your investment decisions.
Trend Analysis:
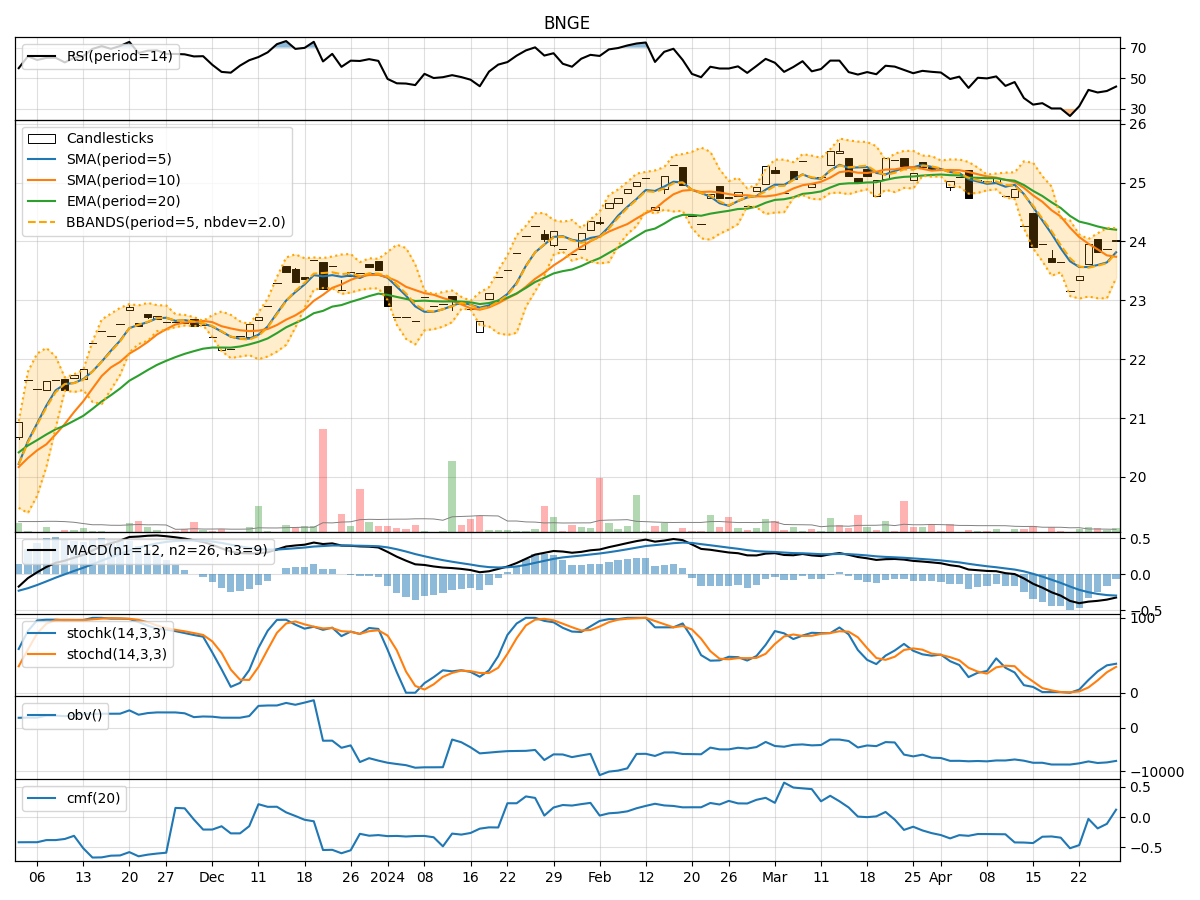
- Moving Averages (MA): The 5-day MA has been fluctuating around the closing prices, indicating a relatively stable trend.
- MACD: The MACD line has been consistently below the signal line, suggesting a bearish momentum in the short term.
- RSI: The RSI values have been declining, indicating a weakening bullish momentum.
Key Observation: The trend indicators suggest a neutral to slightly bearish sentiment in the short term.
Momentum Analysis:
- Stochastic Oscillator: Both %K and %D values have been decreasing, signaling a potential bearish momentum.
- Williams %R: The Williams %R values have been in the oversold territory, indicating a possible reversal.
Key Observation: Momentum indicators point towards a bearish bias in the near future.
Volatility Analysis:
- Bollinger Bands (BB): The stock price has been trading within the bands, with the %B indicator hovering around the midline.
- Average True Range (ATR): The ATR values have been relatively stable, suggesting consistent price movements.
Key Observation: Volatility indicators indicate a period of consolidation and range-bound trading.
Volume Analysis:
- On-Balance Volume (OBV): The OBV values have been fluctuating, reflecting mixed buying and selling pressure.
- Chaikin Money Flow (CMF): The CMF values have been declining, indicating a decrease in buying pressure.
Key Observation: Volume indicators show a lack of strong conviction from market participants.
Conclusion:
Based on the analysis of the technical indicators, the next few days for BNGE are likely to see further downward movement in the stock price. The trend indicators suggest a neutral to bearish outlook, while momentum indicators point towards a bearish bias. Volatility indicators indicate a period of consolidation, and volume indicators reflect mixed market sentiment.
Overall Assessment: The stock is likely to experience a bearish trend in the coming days, with potential downward price movements. Traders should exercise caution and consider short-term selling strategies or wait for a clearer signal before entering new positions.