Technical Analysis of BNKU 2024-05-10
Overview:
In analyzing the technical indicators for BNKU over the last 5 days, we will delve into the trends, momentum, volatility, and volume indicators to provide a comprehensive outlook on the possible stock price movement in the coming days. By examining these key aspects, we aim to offer valuable insights and predictions to guide your investment decisions.
Trend Indicators:
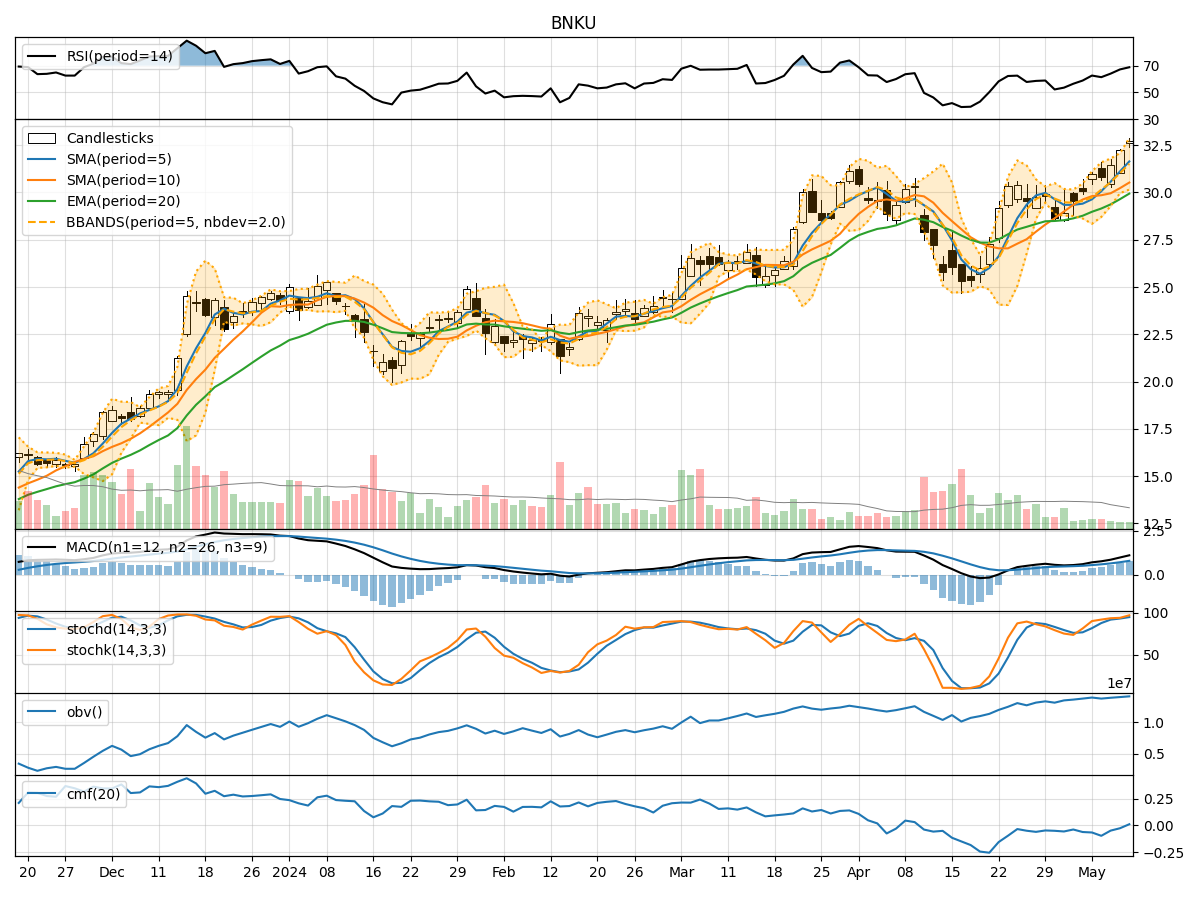
- Moving Averages (MA): The moving averages have been showing an upward trend, with the 5-day MA consistently above the longer-term SMAs and EMAs. This indicates a bullish momentum in the stock price.
- MACD: The MACD line has been consistently above the signal line, with both lines showing an increasing positive trend. This suggests strong bullish momentum in the stock.
- Conclusion: The trend indicators point towards a strong bullish sentiment in the stock price.
Momentum Indicators:
- RSI: The RSI has been trending upwards and is currently in the overbought territory, indicating a strong buying momentum in the stock.
- Stochastic Oscillator: Both %K and %D lines of the stochastic oscillator are in the overbought zone, suggesting a potential reversal or consolidation in the stock price.
- Conclusion: The momentum indicators signal a potential consolidation or pullback in the stock price after the recent bullish run.
Volatility Indicators:
- Bollinger Bands: The stock price has been consistently trading above the upper Bollinger Band, indicating an overbought condition. However, the bands have been widening, suggesting increased volatility in the stock.
- Conclusion: The volatility indicators imply a highly volatile trading environment, with a possibility of a price correction or reversal.
Volume Indicators:
- On-Balance Volume (OBV): The OBV has been showing a slight increase, indicating a positive accumulation of volume in the stock.
- Chaikin Money Flow (CMF): The CMF has been negative, suggesting a slight outflow of money from the stock.
- Conclusion: The volume indicators present a mixed signal, with OBV showing accumulation while CMF indicating slight distribution.
Overall Conclusion:
Based on the analysis of the technical indicators, the stock of BNKU is currently exhibiting a strong bullish trend supported by the moving averages and MACD. However, the momentum indicators suggest a potential consolidation or pullback in the stock price due to overbought conditions. The volatility indicators point towards a highly volatile trading environment, indicating a possible price correction. The volume indicators provide a mixed signal with accumulation in OBV but slight distribution in CMF.
Recommendation:
Considering the overall analysis, it is advisable to exercise caution in trading BNKU in the coming days. While the bullish trend is strong, the overbought conditions and potential consolidation indicated by momentum indicators warrant careful monitoring. Traders may consider taking profits or implementing risk management strategies to navigate the expected volatility and possible price correction. Long-term investors can hold their positions but should remain vigilant for any signs of a trend reversal.
Key Takeaways:
- Trend: Strong Bullish
- Momentum: Potential Consolidation or Pullback
- Volatility: Highly Volatile
- Volume: Mixed Signal
Final Verdict:
In conclusion, while the stock of BNKU has shown a strong bullish trend, the technical indicators suggest a potential consolidation or pullback in the near term. Traders should remain cautious and implement appropriate risk management strategies to navigate the expected volatility. It is essential to closely monitor the price action and key support/resistance levels to make informed trading decisions.