Technical Analysis of BOAT 2024-05-10
Overview:
In analyzing the technical indicators for BOAT stock over the last 5 days, we will delve into the trend, momentum, volatility, and volume indicators to provide a comprehensive outlook on the possible stock price movement in the coming days. By examining these key indicators, we aim to offer valuable insights and predictions for informed decision-making.
Trend Analysis:
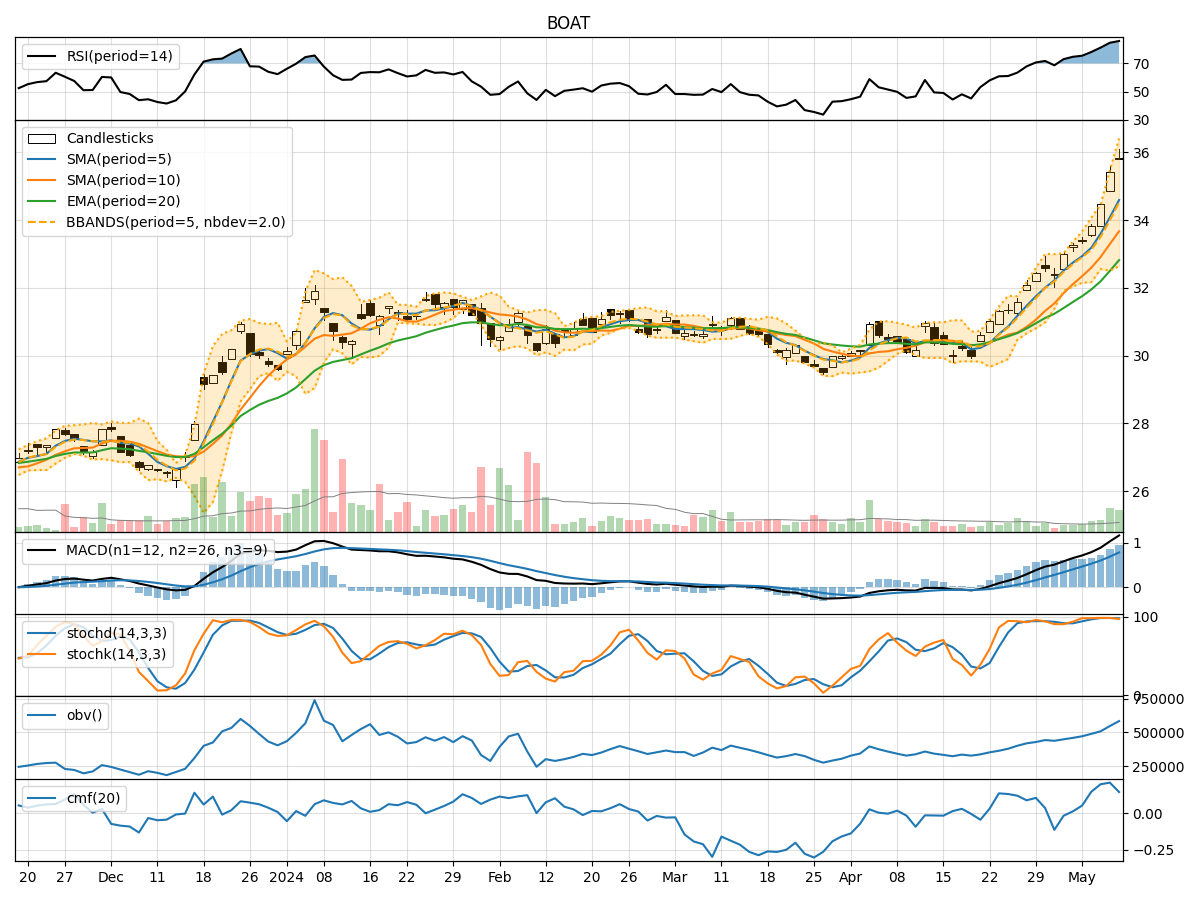
- Moving Averages (MA): The 5-day Moving Average (MA) has been consistently rising, indicating a bullish trend in the short term.
- MACD: The MACD line has been increasing, crossing above the signal line, suggesting a strengthening bullish momentum.
- Relative Strength Index (RSI): The RSI is in the overbought territory, indicating a strong bullish sentiment in the market.
Key Observation: The trend indicators point towards a strong bullish trend in the stock.
Momentum Analysis:
- Stochastic Oscillator: Both %K and %D lines are at high levels, suggesting an overbought condition.
- Williams %R (WillR): The Williams %R is in the oversold region, indicating a potential reversal in the short term.
Key Observation: Momentum indicators show conflicting signals with stochastic oscillator signaling overbought conditions while Williams %R indicating oversold levels.
Volatility Analysis:
- Bollinger Bands (BB): The stock price has been consistently trading above the upper Bollinger Band, indicating high volatility and a potential reversal.
- Bollinger %B (BBP): The %B is decreasing, suggesting a possible decrease in volatility.
Key Observation: Volatility indicators signal a potential decrease in volatility and a reversal in the stock price movement.
Volume Analysis:
- On-Balance Volume (OBV): The OBV has been steadily increasing, indicating strong buying pressure in the stock.
- Chaikin Money Flow (CMF): The CMF is positive, reflecting a bullish money flow into the stock.
Key Observation: Volume indicators support the bullish sentiment with increasing OBV and positive CMF.
Conclusion:
Based on the analysis of the technical indicators, the stock is currently in an overbought condition with conflicting signals from momentum indicators. The trend indicators suggest a strong bullish trend, while volatility indicators hint at a potential reversal due to high volatility levels. Volume indicators support the bullish sentiment with strong buying pressure.
Forecast:
Considering the overall analysis, the next few days may see a consolidation phase or a minor pullback in the stock price as it corrects from the overbought levels. Traders should exercise caution and consider potential profit-taking opportunities in the short term.