Technical Analysis of BOCT 2024-05-10
Overview:
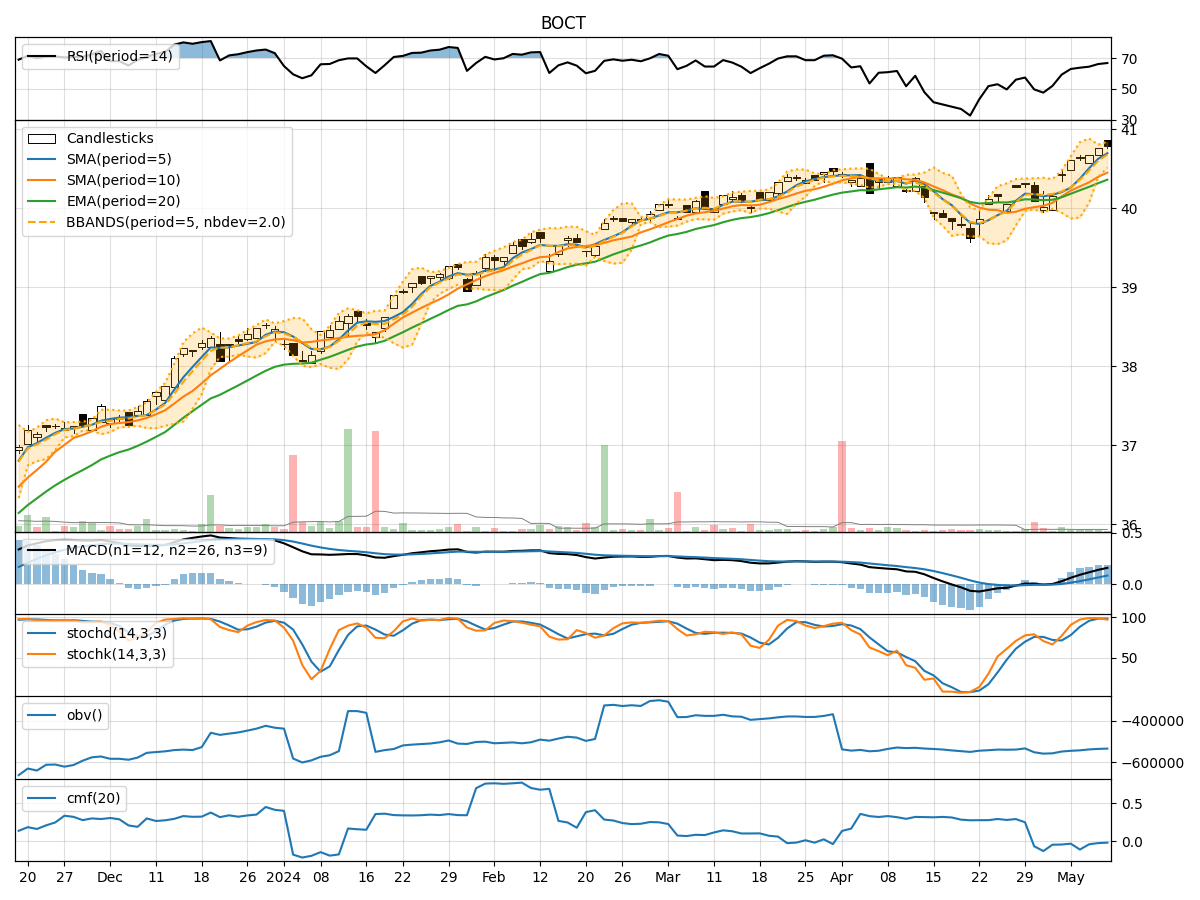
In analyzing the technical indicators for BOCT stock over the last 5 days, we will delve into the trend, momentum, volatility, and volume indicators to provide a comprehensive outlook on the possible stock price movement in the coming days. By examining these key indicators, we aim to offer valuable insights and predictions for potential investors.
Trend Indicators:
- Moving Averages (MA): The moving averages have been showing an upward trend, with the 5-day MA consistently above the 10-day SMA and 20-day EMA. This indicates a positive momentum in the stock price.
- MACD: The MACD line has been consistently above the signal line, indicating a bullish trend in the stock price.
- MACD Histogram: The MACD histogram has been increasing over the last 5 days, suggesting a strengthening bullish momentum.
Momentum Indicators:
- RSI: The RSI has been gradually increasing and is currently in the overbought territory, indicating a strong bullish momentum.
- Stochastic Oscillator: Both %K and %D lines of the Stochastic Oscillator are in the overbought zone, suggesting a potential reversal or consolidation in the stock price.
- Williams %R: The Williams %R is in the oversold territory, indicating a potential buying opportunity.
Volatility Indicators:
- Bollinger Bands: The stock price has been trading within the upper Bollinger Band, indicating an overbought condition. However, the bands are not widening significantly, suggesting a possible consolidation phase.
- Bollinger %B: The %B indicator is above 0.8, indicating that the stock price is trading near the upper band, signaling a potential reversal or pullback.
Volume Indicators:
- On-Balance Volume (OBV): The OBV has been showing a slight decrease over the last 5 days, indicating some distribution happening in the stock.
- Chaikin Money Flow (CMF): The CMF is negative, suggesting that money is flowing out of the stock.
Conclusion:
Based on the analysis of the technical indicators, the stock is currently in an overbought condition with strong bullish momentum. However, the Stochastic Oscillator and Bollinger %B indicators suggest a potential reversal or consolidation in the stock price in the near term. The decreasing OBV and negative CMF also indicate some distribution in the stock.
Recommendation:
Considering the overbought condition and potential reversal signals from the Stochastic Oscillator and Bollinger %B, it is advisable to exercise caution in entering new long positions at the current levels. Traders may consider taking profits or implementing risk management strategies to protect gains. Monitoring the price action for signs of a reversal or consolidation would be prudent before making any further investment decisions.