Technical Analysis of BOTZ 2024-05-10
Overview:
In analyzing the technical indicators for the BOTZ stock over the last 5 days, we will delve into the trends, momentum, volatility, and volume indicators to provide a comprehensive outlook on the possible stock price movement in the coming days. By examining these key aspects, we aim to offer valuable insights and predictions to guide your investment decisions.
Trend Analysis:
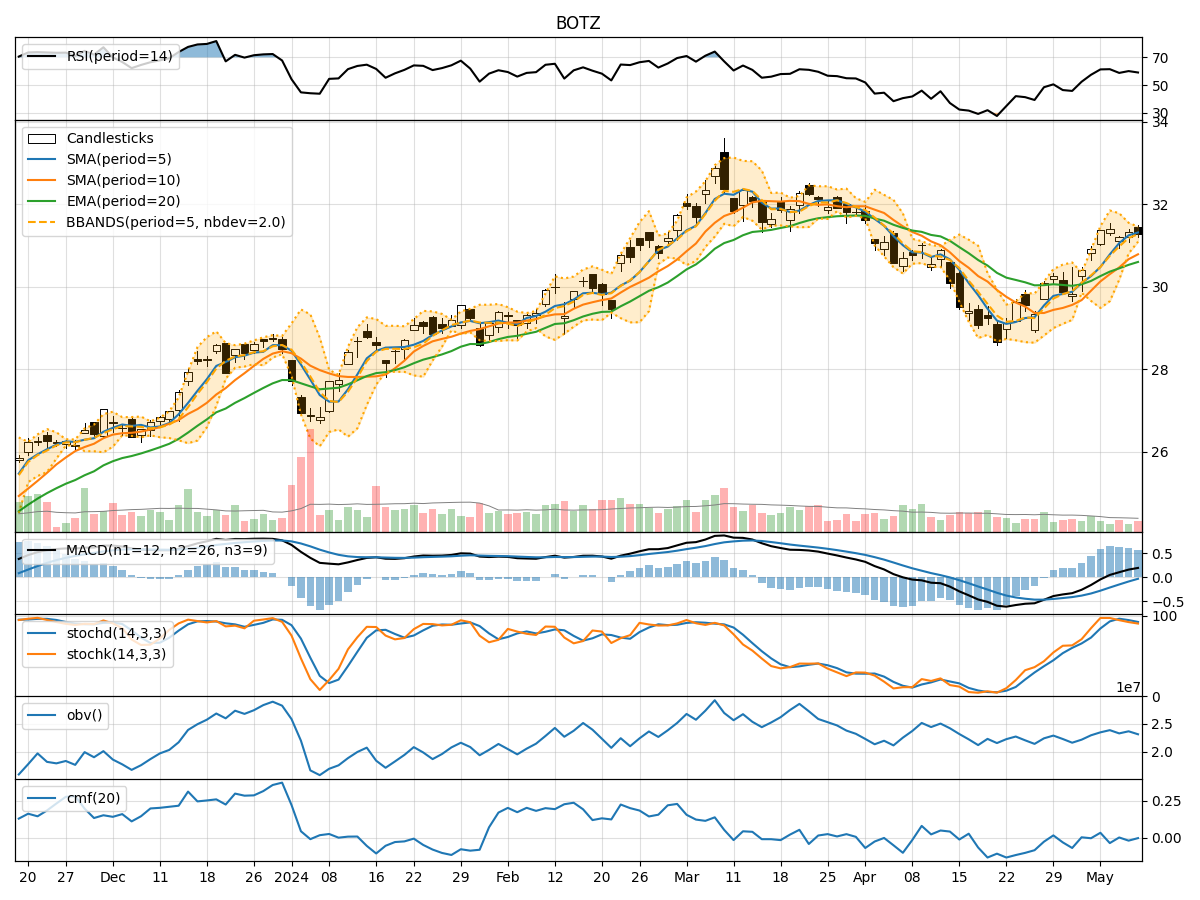
- Moving Averages (MA): The 5-day Moving Average (MA) has been consistently above the Simple Moving Average (SMA) and Exponential Moving Average (EMA), indicating a bullish trend.
- MACD: The Moving Average Convergence Divergence (MACD) has shown positive values, with the MACD line consistently above the Signal line, suggesting bullish momentum.
Momentum Analysis:
- RSI: The Relative Strength Index (RSI) has been fluctuating around the 60-61 range, indicating a neutral momentum.
- Stochastic Oscillator: Both %K and %D values have been gradually decreasing, signaling a potential shift towards oversold conditions.
Volatility Analysis:
- Bollinger Bands (BB): The stock price has mostly remained within the Bollinger Bands, with the %B indicator hovering around the midline, suggesting moderate volatility.
Volume Analysis:
- On-Balance Volume (OBV): The OBV indicator has shown mixed signals, with fluctuations in volume accumulation.
- Chaikin Money Flow (CMF): The CMF has been slightly negative, indicating some selling pressure in the market.
Key Observations:
- The trend indicators suggest a bullish sentiment, supported by the positive MACD values and the MA positioning.
- Momentum indicators show a neutral stance, with the RSI hovering around the midpoint and stochastic indicators pointing towards potential oversold conditions.
- Volatility remains moderate, as indicated by the Bollinger Bands and %B indicator.
- Volume indicators reflect mixed signals, with fluctuations in volume accumulation and slight selling pressure indicated by the CMF.
Conclusion:
Based on the analysis of the technical indicators, the overall outlook for the BOTZ stock in the next few days leans towards a continuation of the bullish trend. While momentum indicators suggest a neutral stance, the positive trend indicators and moderate volatility point towards a potential upward movement in the stock price. Traders and investors may consider buying opportunities in anticipation of a possible price increase. However, it is essential to monitor the stochastic indicators for potential oversold conditions and adjust strategies accordingly.
Recommendation:
- Consider buying positions in BOTZ stock based on the bullish trend signals from the moving averages and MACD.
- Monitor stochastic indicators for potential entry points during oversold conditions.
- Stay vigilant on volume fluctuations and adjust positions accordingly to manage risk effectively.
By combining insights from trend, momentum, volatility, and volume indicators, investors can make informed decisions to capitalize on potential price movements in the BOTZ stock.