Technical Analysis of BOUT 2024-05-10
Overview:
In analyzing the technical indicators for BOUT stock over the last 5 days, we will delve into the trend, momentum, volatility, and volume indicators to provide a comprehensive assessment of the stock's potential price movement. By examining these key factors, we aim to offer valuable insights and predictions for the next few days.
Trend Analysis:
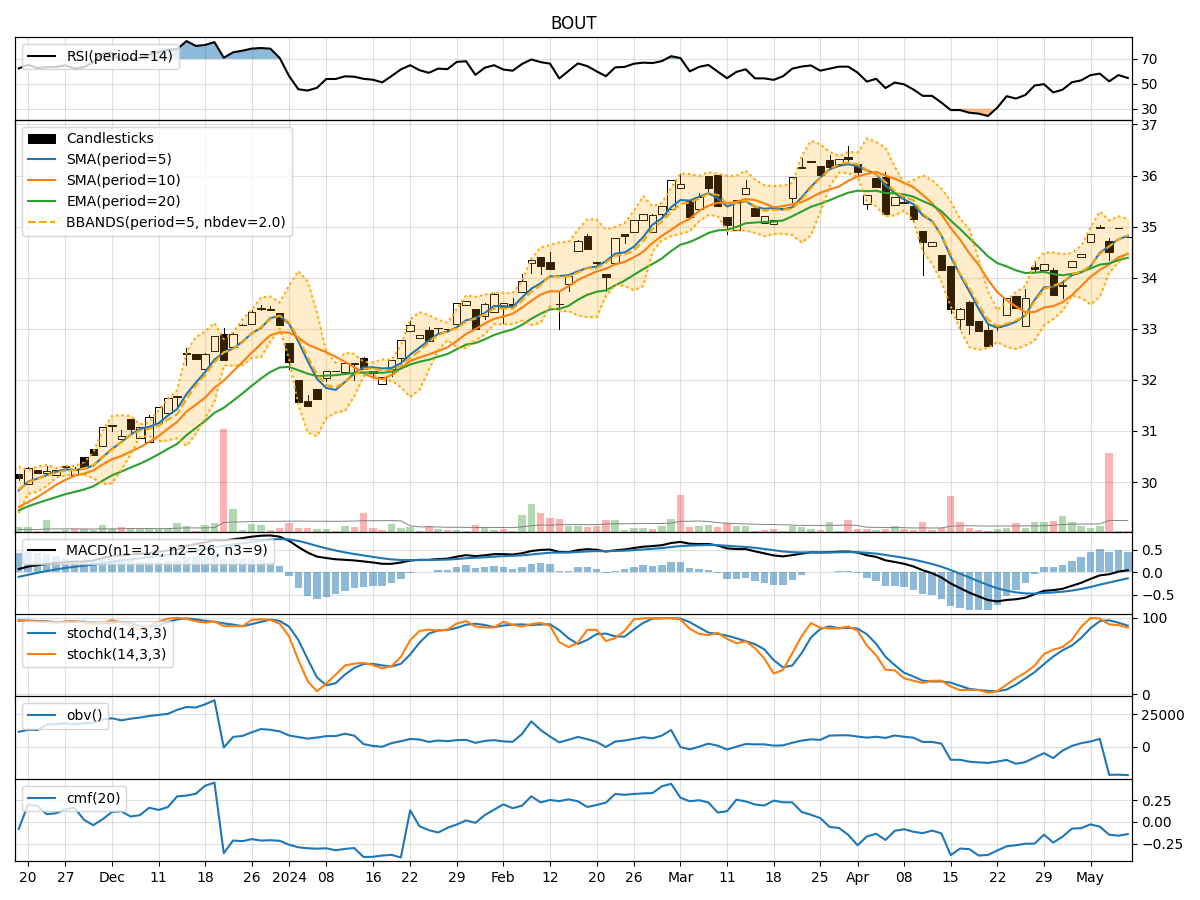
- Moving Averages (MA): The 5-day Moving Average (MA) has been consistently above both the Simple Moving Average (SMA) and Exponential Moving Average (EMA), indicating a short-term bullish trend.
- MACD: The MACD line has been positive, with the MACD Histogram showing an increasing trend, suggesting bullish momentum.
- RSI: The Relative Strength Index (RSI) has been fluctuating around the neutral zone, indicating a balanced market sentiment.
Momentum Analysis:
- Stochastic Oscillator: The Stochastic Oscillator has been gradually decreasing but remains in the overbought territory, signaling a potential reversal or consolidation.
- Williams %R: The Williams %R indicator has been hovering in the oversold region, suggesting a possible buying opportunity.
Volatility Analysis:
- Bollinger Bands (BB): The Bollinger Bands have been narrowing, indicating decreasing volatility and a potential price breakout in the near future.
Volume Analysis:
- On-Balance Volume (OBV): The OBV has been negative, suggesting a net selling pressure in the market.
- Chaikin Money Flow (CMF): The CMF has been consistently negative, indicating a bearish money flow trend.
Key Observations:
- The trend indicators suggest a short-term bullish sentiment, supported by positive MACD and MA crossovers.
- Momentum indicators show signs of potential reversal or consolidation, with the Stochastic Oscillator and Williams %R pointing towards overbought and oversold conditions, respectively.
- Volatility is decreasing, as indicated by the narrowing Bollinger Bands, hinting at a possible price breakout.
- Volume indicators reflect a negative sentiment, with OBV and CMF signaling selling pressure in the market.
Conclusion:
Based on the analysis of the technical indicators, the next few days for BOUT stock may see sideways consolidation with a slight upward bias. Traders should closely monitor the Stochastic Oscillator and Williams %R for potential reversal signals, while keeping an eye on the Bollinger Bands for a breakout confirmation. Overall, caution is advised due to the conflicting signals from momentum and volume indicators, suggesting a mixed market sentiment.