Technical Analysis of BRAZ 2024-05-10
Overview:
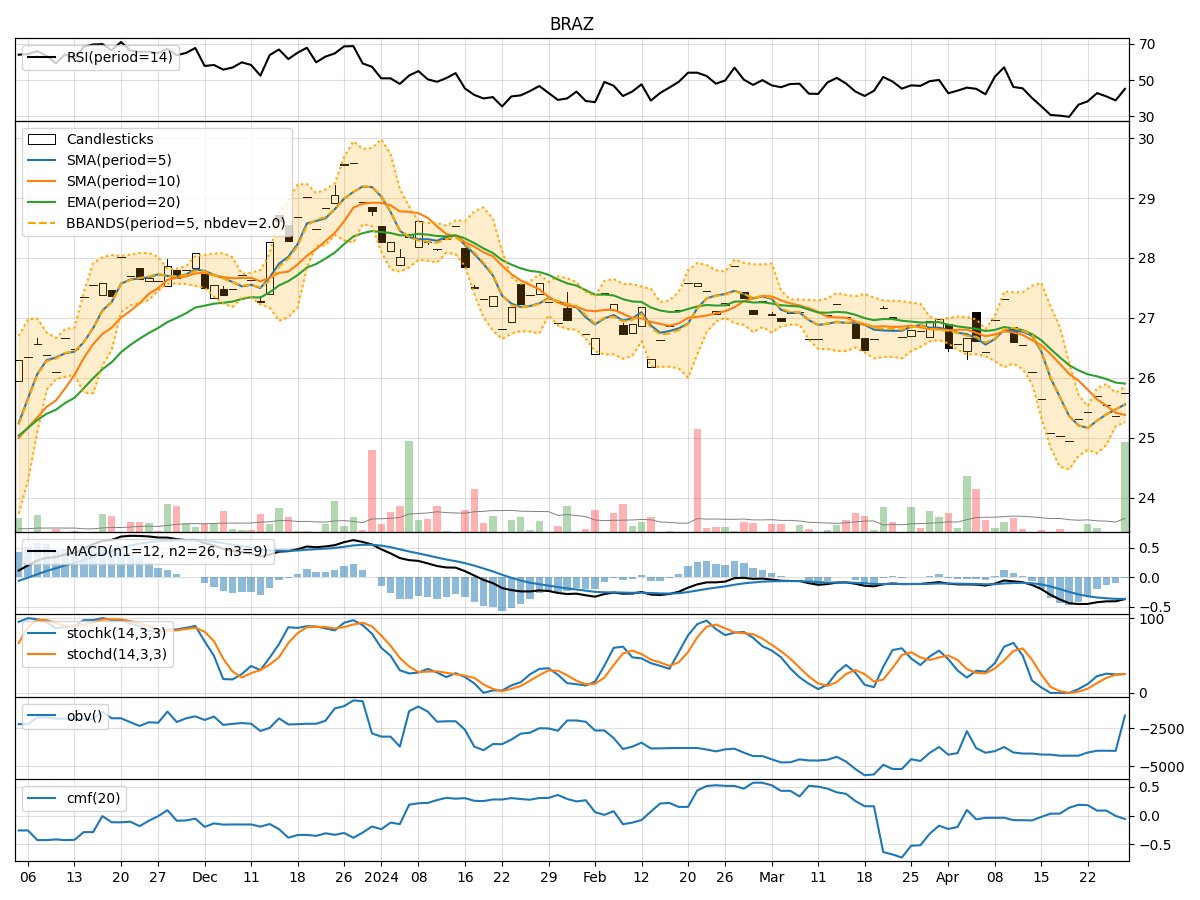
In analyzing the technical indicators for the stock of BRAZ over the last 5 days, we will delve into the trends, momentum, volatility, and volume indicators to provide a comprehensive outlook on the possible stock price movement in the coming days.
Trend Indicators:
- Moving Averages (MA): The 5-day Moving Average (MA) has been consistently above the Simple Moving Average (SMA) and Exponential Moving Average (EMA), indicating a short-term uptrend.
- MACD: The Moving Average Convergence Divergence (MACD) has shown positive values, suggesting bullish momentum.
- MACD Histogram: The MACD Histogram has been positive, further supporting the bullish sentiment.
Momentum Indicators:
- RSI: The Relative Strength Index (RSI) has been fluctuating around the neutral zone, indicating indecision in the market.
- Stochastic Oscillator: The Stochastic Oscillator has been showing mixed signals, with some oversold conditions in the past few days.
Volatility Indicators:
- Bollinger Bands (BB): The Bollinger Bands have shown narrowing bands, indicating decreasing volatility.
- Bollinger %B: The %B indicator has been hovering around the middle, suggesting a balanced market sentiment.
Volume Indicators:
- On-Balance Volume (OBV): The OBV has shown some fluctuations but has not provided a clear direction.
- Chaikin Money Flow (CMF): The CMF has been positive, indicating potential buying pressure.
Key Observations and Opinions:
- Trend: The stock has been in a short-term uptrend based on moving averages and MACD indicators.
- Momentum: The momentum indicators are mixed, with RSI showing neutrality and Stochastic Oscillator indicating some oversold conditions.
- Volatility: Volatility has been decreasing based on Bollinger Bands, which could signal a period of consolidation.
- Volume: Volume indicators have not provided a clear direction, but the positive CMF suggests some buying interest.
Conclusion:
Based on the analysis of the technical indicators, the stock of BRAZ is likely to experience sideways movement or consolidation in the coming days. The mixed signals from momentum indicators and the decreasing volatility point towards a period of indecision in the market. Traders may need to exercise caution and wait for clearer signals before taking significant positions.