Technical Analysis of BRF 2024-05-10
Overview:
In analyzing the technical indicators for BRF stock over the last 5 days, we will delve into the trend, momentum, volatility, and volume indicators to provide a comprehensive outlook on the possible future stock price movement. By examining these key indicators, we aim to offer valuable insights and predictions for the upcoming trading days.
Trend Analysis:
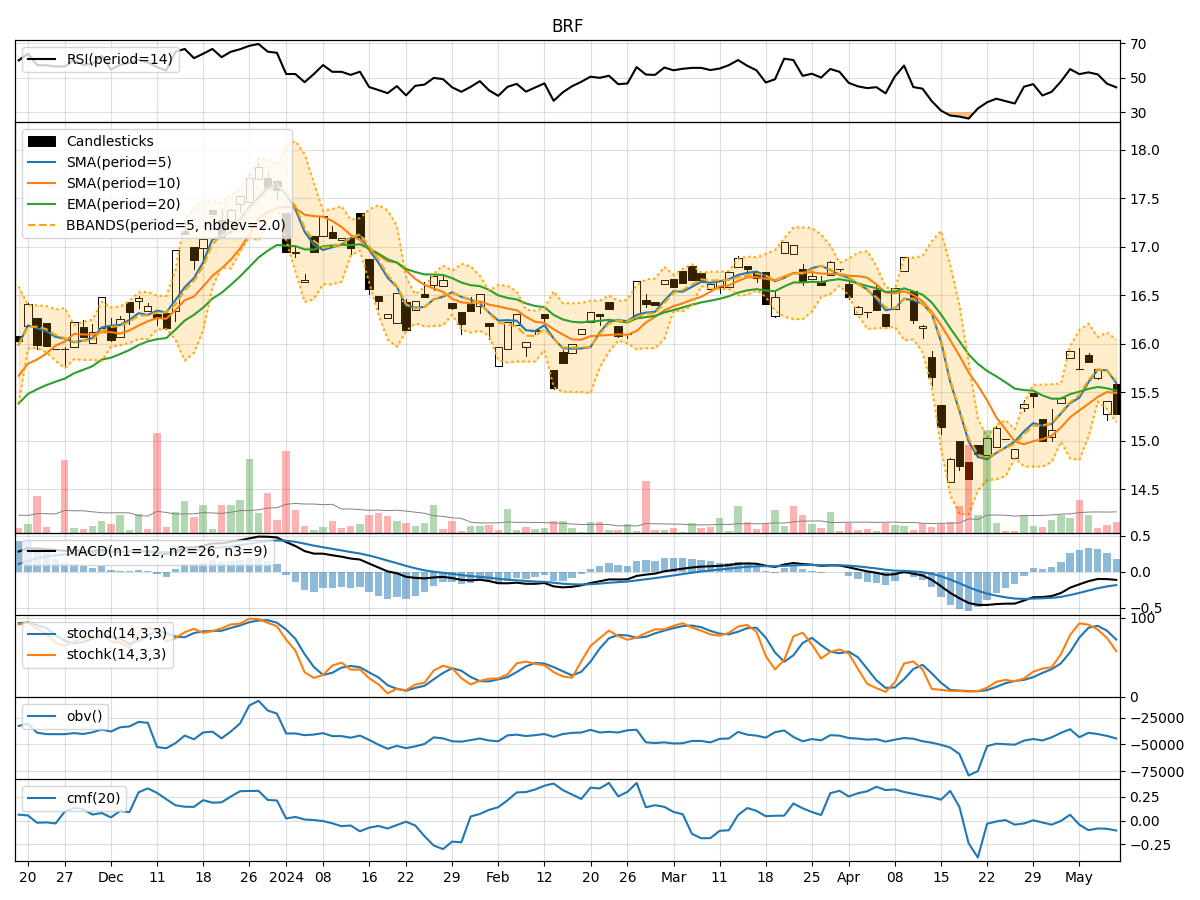
- Moving Averages (MA): The 5-day Moving Average (MA) has been fluctuating around the closing prices, indicating short-term price trends. The Simple Moving Average (SMA) and Exponential Moving Average (EMA) show a slight downward trend, suggesting a potential bearish sentiment.
- MACD: The Moving Average Convergence Divergence (MACD) and its signal line have been negative, indicating a bearish trend in the stock price momentum.
Momentum Analysis:
- RSI: The Relative Strength Index (RSI) has been hovering around the neutral zone, indicating a lack of strong momentum in either direction.
- Stochastic Oscillator: Both %K and %D levels of the Stochastic Oscillator have been declining, suggesting a weakening bullish momentum.
Volatility Analysis:
- Bollinger Bands (BB): The Bollinger Bands have been narrowing, indicating decreasing volatility in the stock price.
Volume Analysis:
- On-Balance Volume (OBV): The OBV has shown mixed signals, with fluctuations in volume accumulation, reflecting indecision among market participants.
- Chaikin Money Flow (CMF): The CMF has been negative, indicating a bearish money flow trend.
Key Observations:
- The trend indicators suggest a bearish sentiment with downward moving averages and negative MACD.
- Momentum indicators show a lack of strong momentum, with RSI near neutrality and declining Stochastic levels.
- Volatility has been decreasing, as indicated by the narrowing Bollinger Bands.
- Volume indicators reflect mixed signals, with OBV showing fluctuations and CMF indicating bearish money flow.
Conclusion:
Based on the analysis of the technical indicators, the outlook for BRF stock in the next few days is bearish. The trend indicators, momentum signals, and volume analysis all point towards a potential downward movement in the stock price. Traders and investors should exercise caution and consider short-term bearish strategies or wait for a clearer trend reversal signal before considering long positions.