Technical Analysis of BRLN 2024-05-10
Overview:
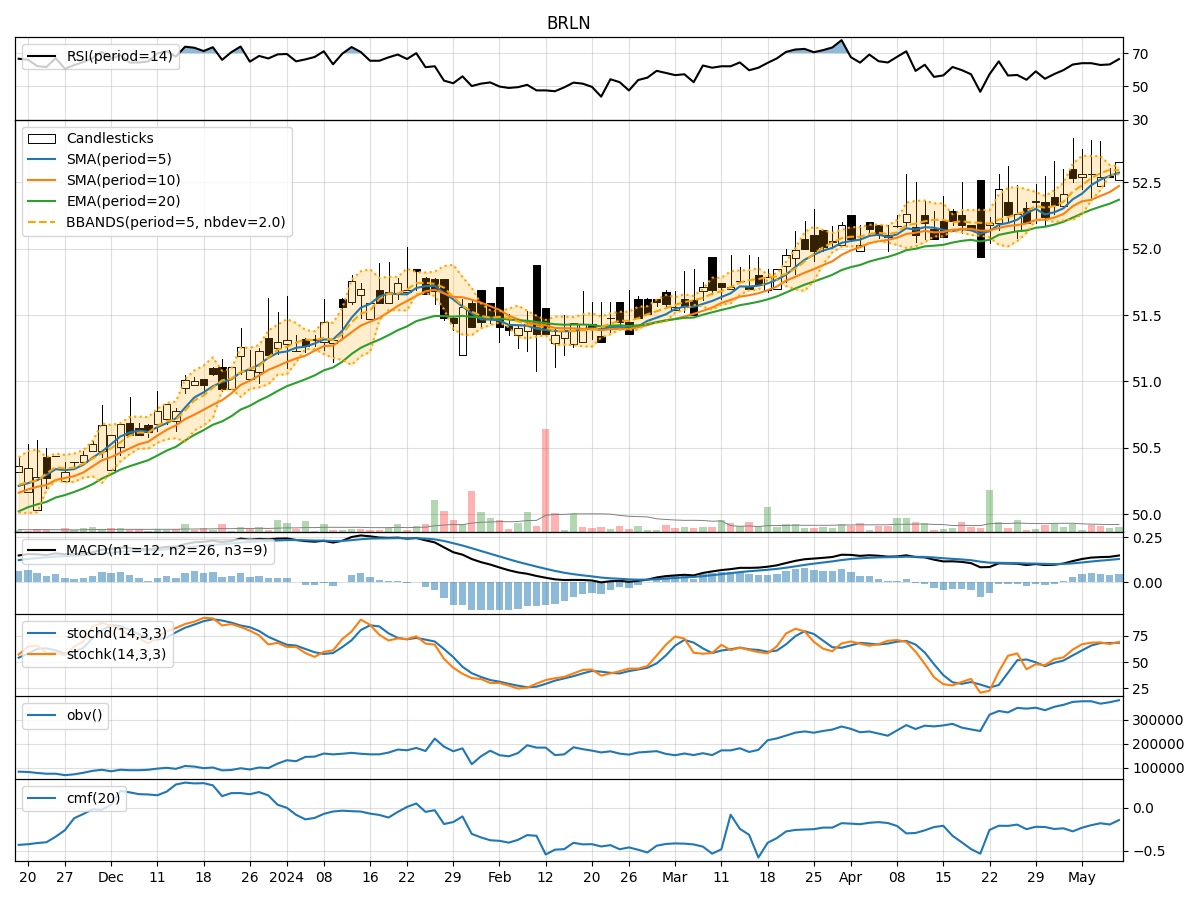
In analyzing the technical indicators for BRLN over the last 5 days, we will delve into the trend, momentum, volatility, and volume indicators to provide a comprehensive outlook on the possible stock price movement in the coming days. By examining key metrics such as moving averages, MACD, RSI, Bollinger Bands, and OBV, we aim to offer valuable insights and predictions for potential price action.
Trend Indicators:
- Moving Averages (MA): The 5-day MA has been consistently above the closing prices, indicating a short-term uptrend.
- MACD: The MACD line has been trending upwards, with the MACD histogram showing positive values, suggesting bullish momentum.
- EMA: The EMA has been steadily increasing, reflecting a positive trend in the stock price.
Momentum Indicators:
- RSI: The RSI values have been in the neutral to slightly overbought territory, indicating moderate buying pressure.
- Stochastic Oscillator: Both %K and %D have been in the overbought zone, suggesting a potential reversal or consolidation.
- Williams %R: The Williams %R has been fluctuating around the oversold region, signaling potential buying opportunities.
Volatility Indicators:
- Bollinger Bands: The stock price has mostly stayed within the bands, indicating a stable price range.
- Bollinger %B: The %B values have fluctuated, suggesting potential shifts in volatility.
- Bollinger Band Width: The band width has shown variations, indicating periods of both contraction and expansion in volatility.
Volume Indicators:
- On-Balance Volume (OBV): The OBV has shown mixed movements, reflecting indecision among market participants.
- Chaikin Money Flow (CMF): The CMF values have been negative, indicating selling pressure in the stock.
Key Observations and Opinions:
- Trend: The stock is in an upward trend based on moving averages and MACD.
- Momentum: Momentum indicators suggest a mixed outlook with potential for a reversal or consolidation.
- Volatility: Bollinger Bands indicate stable price action with occasional volatility spikes.
- Volume: Volume indicators show indecisiveness among investors with a slight bias towards selling pressure.
Conclusion:
Based on the analysis of technical indicators, the next few days for BRLN could see further upside potential in the stock price, supported by the positive trend and momentum signals. However, caution is advised as momentum indicators hint at a possible reversal or consolidation. Traders should closely monitor key levels and wait for confirmation before making trading decisions.