Technical Analysis of BRRR 2024-05-10
Overview:
In analyzing the technical indicators for BRRR stock over the last 5 days, we will delve into the trend, momentum, volatility, and volume indicators to provide a comprehensive outlook on the possible stock price movement in the coming days. By examining these key indicators, we aim to offer valuable insights and predictions to guide investment decisions.
Trend Analysis:
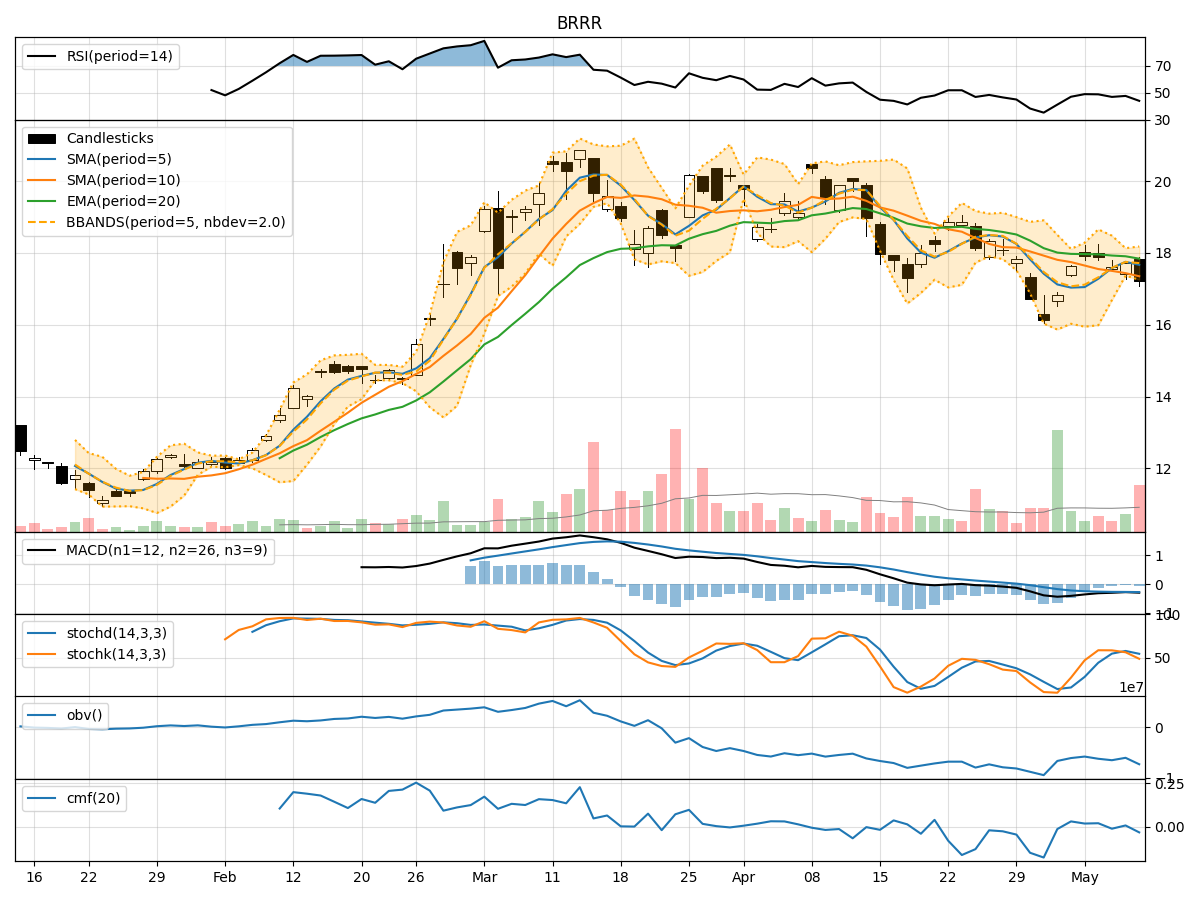
- Moving Averages (MA): The 5-day Moving Average (MA) has been fluctuating around the closing prices, indicating short-term price trends. The Simple Moving Average (SMA) and Exponential Moving Average (EMA) show a slight downtrend, suggesting a bearish sentiment.
- MACD: The Moving Average Convergence Divergence (MACD) line has been negative, with the MACD Histogram also in the negative territory. This indicates a bearish trend in the stock price.
Momentum Analysis:
- RSI: The Relative Strength Index (RSI) has been hovering around the mid-level, indicating a neutral momentum in the stock.
- Stochastic Oscillator: Both %K and %D lines of the Stochastic Oscillator are in the neutral zone, suggesting a lack of strong momentum in either direction.
- Williams %R: The Williams %R is in the oversold territory, indicating a potential reversal or consolidation phase.
Volatility Analysis:
- Bollinger Bands: The Bollinger Bands are narrowing, indicating decreasing volatility in the stock price. The bands are squeezing, which could lead to a breakout in either direction.
- Bollinger %B: The %B indicator is close to the lower band, suggesting a possible oversold condition and a potential bounce back in price.
Volume Analysis:
- On-Balance Volume (OBV): The OBV has been declining over the past few days, indicating selling pressure in the stock.
- Chaikin Money Flow (CMF): The CMF is slightly negative, reflecting a slight outflow of money from the stock.
Conclusion:
Based on the analysis of the technical indicators, the stock is currently in a bearish phase with a lack of strong momentum in either direction. The narrowing Bollinger Bands suggest a potential breakout, while the oversold condition indicated by Williams %R could lead to a short-term bounce back. However, the overall trend and momentum indicators point towards a downward movement in the stock price in the coming days. Investors should exercise caution and consider waiting for more clarity before making any significant trading decisions.