Technical Analysis of BSCQ 2024-05-10
Overview:
In analyzing the technical indicators for BSCQ over the last 5 days, we will delve into the trend, momentum, volatility, and volume indicators to provide a comprehensive outlook on the possible stock price movement in the coming days. By examining these key aspects, we aim to offer valuable insights and recommendations for potential investors.
Trend Analysis:
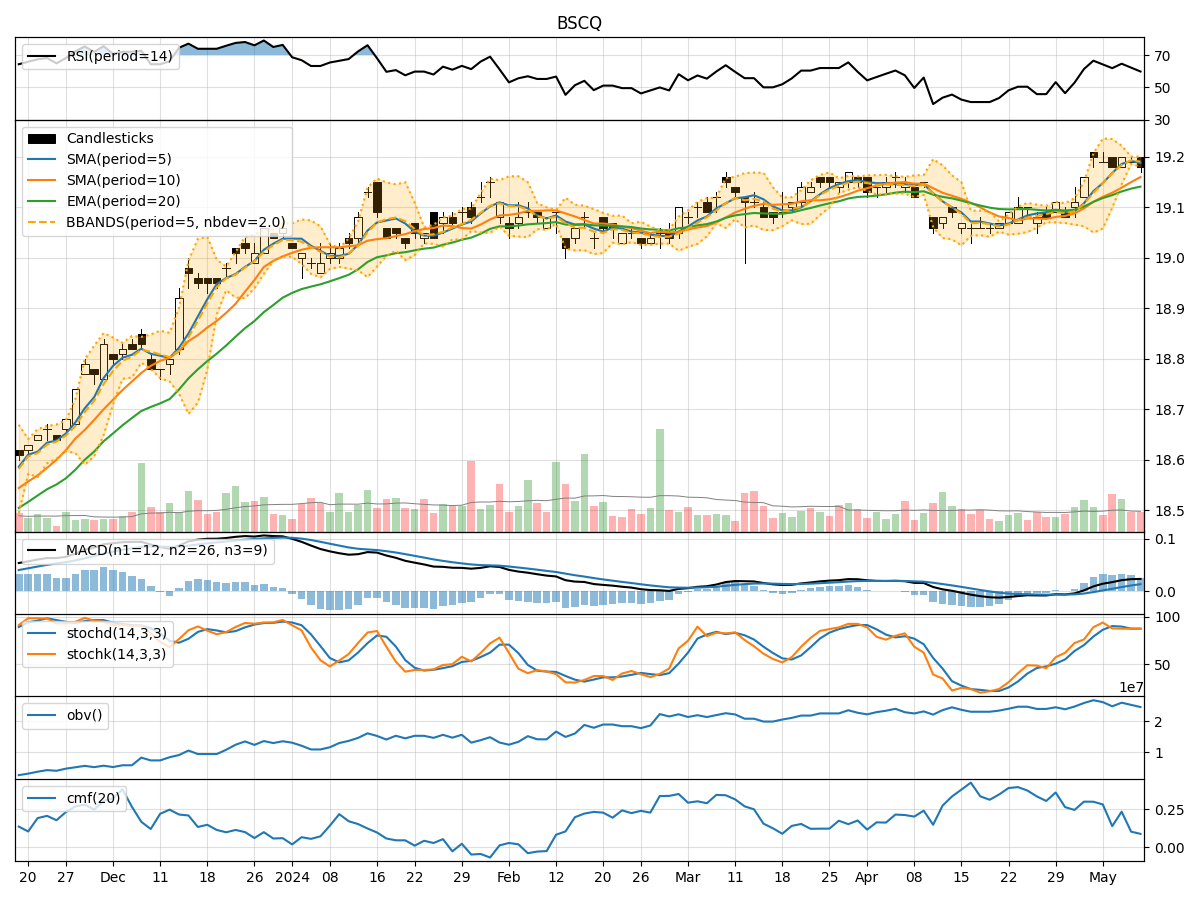
- Moving Averages (MA): The 5-day Moving Average (MA) has been relatively stable around the closing prices, indicating a consistent trend.
- MACD: The Moving Average Convergence Divergence (MACD) has shown a positive trend, with the MACD line consistently above the signal line, suggesting bullish momentum.
Momentum Analysis:
- RSI: The Relative Strength Index (RSI) has been fluctuating around the neutral zone, indicating a balanced momentum.
- Stochastic Oscillator: The Stochastic indicators have been hovering in the overbought territory, suggesting a potential reversal or consolidation.
Volatility Analysis:
- Bollinger Bands (BB): The Bollinger Bands have shown a narrowing range, indicating decreasing volatility and a possible period of consolidation.
Volume Analysis:
- On-Balance Volume (OBV): The OBV has been relatively stable, reflecting a consistent volume trend.
- Chaikin Money Flow (CMF): The CMF has been positive, indicating buying pressure in the market.
Key Observations:
- The trend indicators suggest a bullish sentiment with stable moving averages and a positive MACD.
- Momentum indicators show a mixed signal with RSI fluctuating and stochastic indicators in the overbought zone.
- Volatility indicators point towards decreasing volatility and a potential consolidation phase.
- Volume indicators reflect a stable volume trend with positive buying pressure.
Conclusion:
Based on the analysis of the technical indicators, the stock price of BSCQ is likely to experience a sideways movement or consolidation in the coming days. The bullish trend indicated by moving averages and MACD may be offset by the mixed momentum signals and decreasing volatility. Investors should closely monitor the price action for any signs of a breakout or reversal before making trading decisions.