Technical Analysis of BSCR 2024-05-10
Overview:
In analyzing the technical indicators for BSCR stock over the last 5 days, we will delve into the trend, momentum, volatility, and volume indicators to provide a comprehensive outlook on the possible stock price movement in the coming days. By examining these key indicators, we aim to offer valuable insights and predictions for potential investors.
Trend Analysis:
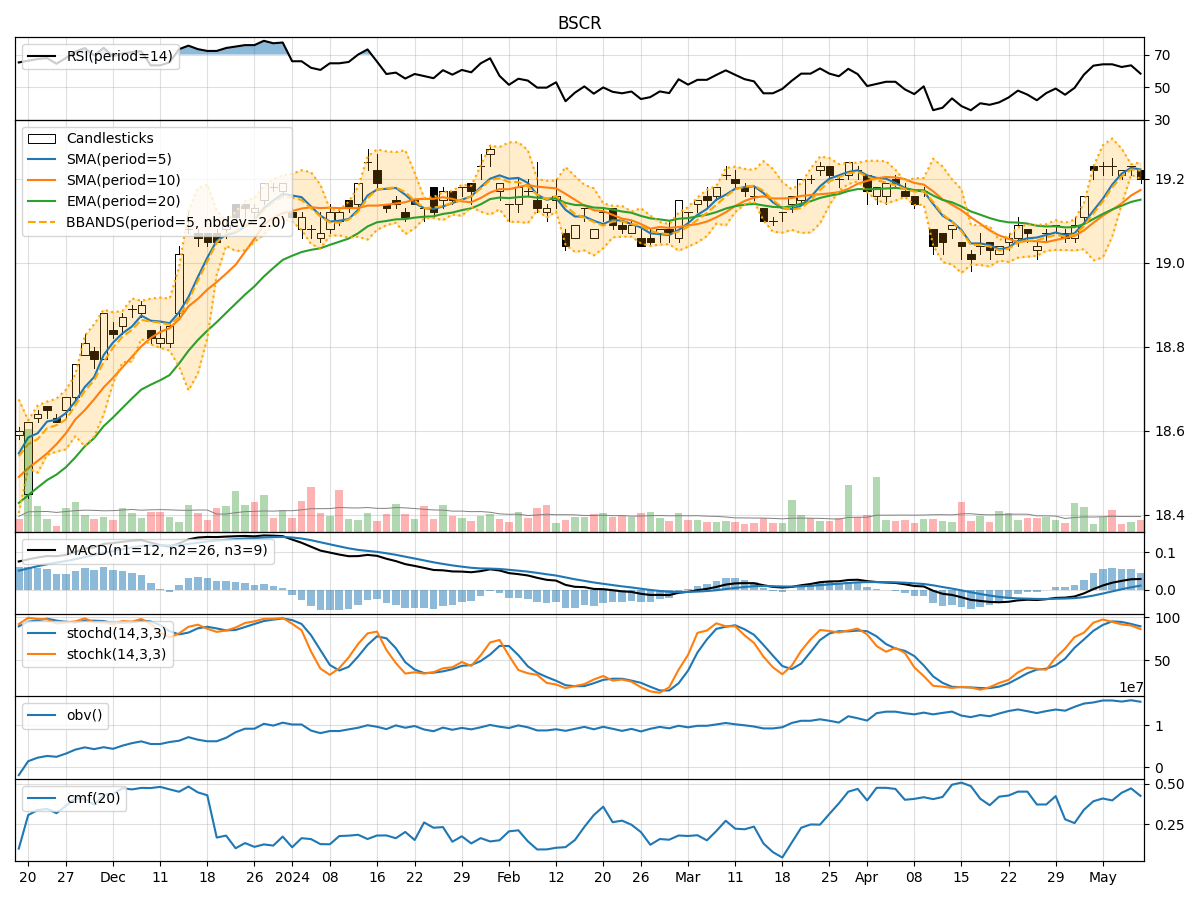
- Moving Averages (MA): The 5-day Moving Average (MA) has been relatively stable around the closing price, indicating a consistent trend.
- MACD: The Moving Average Convergence Divergence (MACD) has shown a positive trend, with the MACD line consistently above the signal line.
- EMA: The Exponential Moving Average (EMA) has been slightly increasing, suggesting a bullish trend.
Key Observation: The trend indicators suggest a bullish sentiment in the stock price movement.
Momentum Analysis:
- RSI: The Relative Strength Index (RSI) has been fluctuating around the neutral zone, indicating a balanced momentum.
- Stochastic Oscillator: Both %K and %D have been gradually decreasing, signaling a potential reversal in momentum.
- Williams %R: The Williams %R is in the oversold territory, suggesting a possible buying opportunity.
Key Observation: The momentum indicators show a neutral to slightly bearish momentum in the stock.
Volatility Analysis:
- Bollinger Bands: The Bollinger Bands have been narrowing, indicating decreasing volatility.
- Bollinger %B: The %B indicator is hovering around the middle, suggesting a balanced volatility level.
Key Observation: The volatility indicators point towards a consolidation phase in the stock price.
Volume Analysis:
- On-Balance Volume (OBV): The OBV has been fluctuating, indicating mixed buying and selling pressure.
- Chaikin Money Flow (CMF): The CMF has been relatively stable, showing a neutral money flow trend.
Key Observation: The volume indicators reflect a balanced trading volume in the stock.
Conclusion:
Based on the analysis of trend, momentum, volatility, and volume indicators, the overall outlook for BSCR stock in the next few days is as follows: - Trend: Upward trend based on MA, MACD, and EMA indicators. - Momentum: Neutral to slightly bearish momentum based on RSI and Stochastic indicators. - Volatility: Consolidation phase based on Bollinger Bands analysis. - Volume: Balanced trading volume based on OBV and CMF indicators.
Final Verdict:
Considering the mixed signals from the technical indicators, it is recommended to exercise caution in trading BSCR stock in the next few days. Investors may consider waiting for more clarity in the market trend before making significant trading decisions.