Technical Analysis of BSCU 2024-05-10
Overview:
In analyzing the technical indicators for BSCU over the last 5 days, we will delve into the trend, momentum, volatility, and volume indicators to provide a comprehensive outlook on the possible stock price movement in the coming days. By examining these key aspects, we aim to offer valuable insights and predictions to guide your investment decisions.
Trend Indicators:
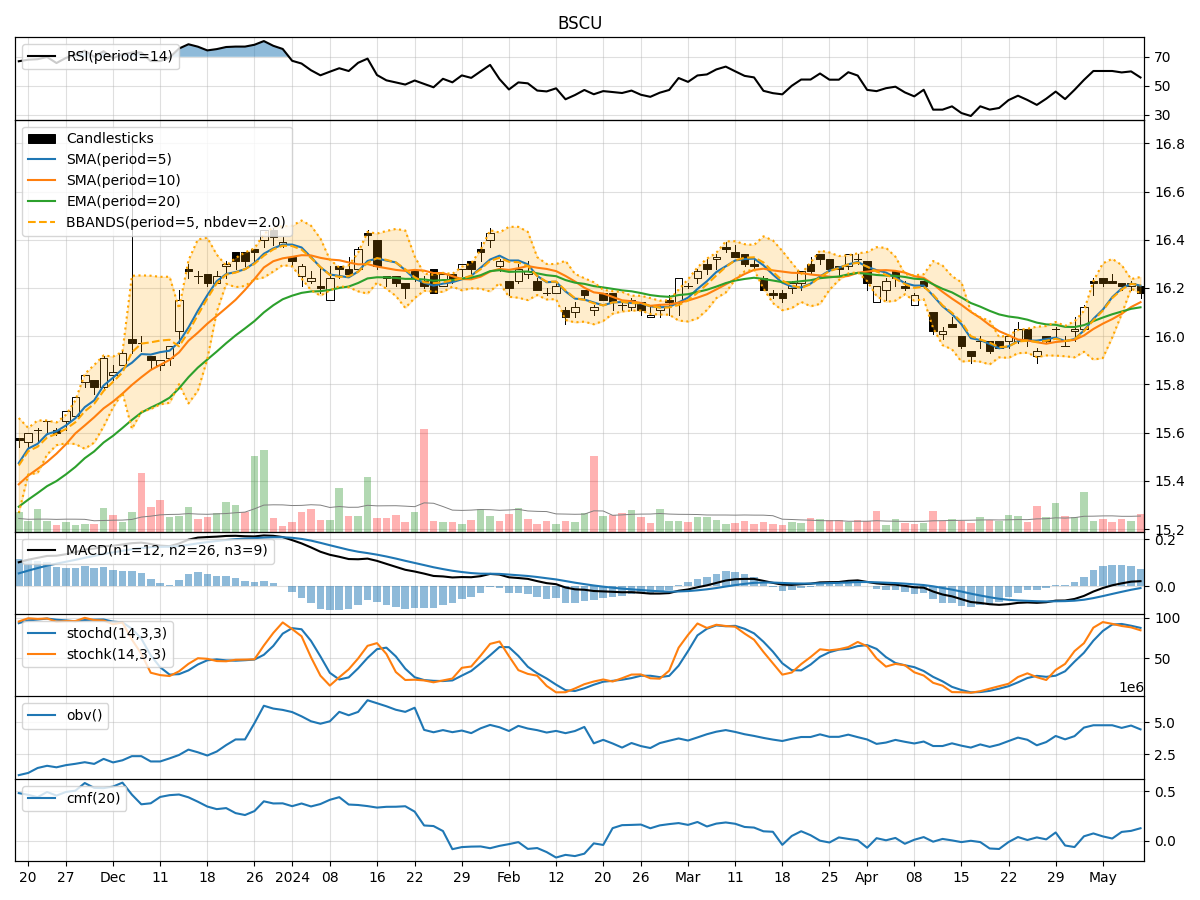
- Moving Averages (MA): The 5-day Moving Average (MA) has been consistently above the Simple Moving Average (SMA) and Exponential Moving Average (EMA), indicating a short-term uptrend.
- MACD: The MACD line has been consistently above the signal line, with both lines showing an upward trend, suggesting bullish momentum.
- MACD Histogram: The MACD Histogram has been consistently above the zero line, indicating increasing bullish momentum.
Momentum Indicators:
- RSI: The Relative Strength Index (RSI) has been fluctuating around the 60 level, indicating a neutral momentum.
- Stochastic Oscillator: Both %K and %D lines of the Stochastic Oscillator have been gradually decreasing but remain in the overbought territory, signaling a potential reversal.
- Williams %R: The Williams %R is in the oversold region, suggesting a possible buying opportunity.
Volatility Indicators:
- Bollinger Bands: The stock price has been trading within the Bollinger Bands, with the bands narrowing, indicating decreasing volatility.
- Bollinger %B: The %B indicator is close to 0.5, suggesting the stock is trading near the middle of the bands.
Volume Indicators:
- On-Balance Volume (OBV): The OBV has been fluctuating, indicating mixed buying and selling pressure.
- Chaikin Money Flow (CMF): The CMF has been positive, suggesting accumulation in the stock.
Key Observations and Opinions:
- Trend: The trend indicators suggest a bullish sentiment in the short term.
- Momentum: Momentum indicators show a mixed picture with neutral to slightly bearish signals.
- Volatility: Volatility has been decreasing, indicating a potential period of consolidation.
- Volume: Volume indicators reflect mixed activity with no clear direction.
Conclusion:
Based on the analysis of the technical indicators, the next few days for BSCU stock price movement could be sideways with a slight bullish bias. While the trend indicators point towards a bullish outlook, the momentum indicators and volume indicators suggest a more neutral stance. The decreasing volatility indicates a potential consolidation phase. Investors should closely monitor key support and resistance levels for potential entry or exit points.
In summary, the overall outlook for BSCU in the next few days leans towards consolidation with a slight bullish bias. It is essential to stay vigilant and adapt to changing market conditions to make informed trading decisions.