Technical Analysis of BSCW 2024-05-10
Overview:
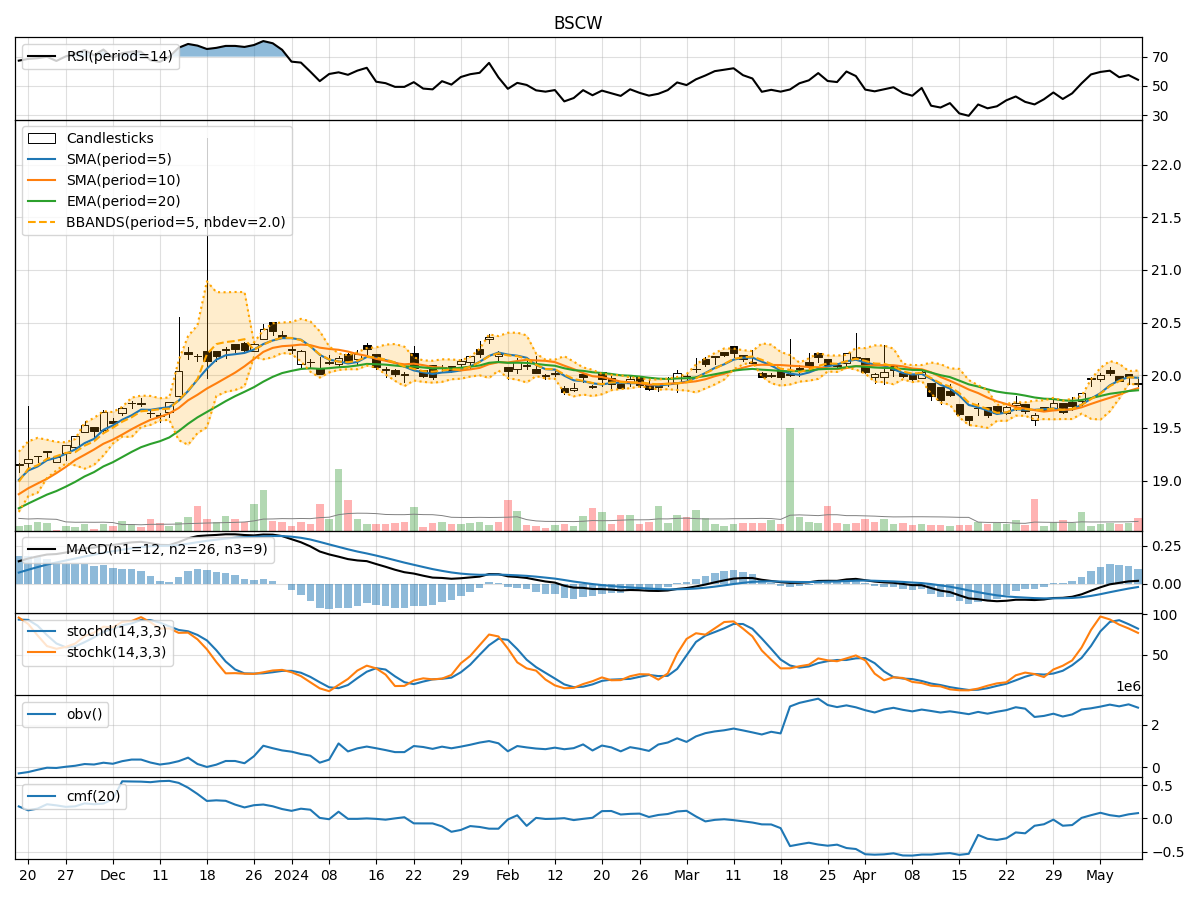
In the last 5 trading days, BSCW stock has shown a relatively stable performance with minor fluctuations in price and volume. The trend indicators suggest a slight uptrend, supported by moving averages and MACD. Momentum indicators indicate a neutral to slightly bearish sentiment, while volatility indicators show a decreasing trend. Volume indicators also reflect a neutral sentiment with no significant divergence.
Trend Indicators:
- Moving averages (MA) are slightly trending upwards, indicating a potential bullish sentiment.
- MACD is positive, suggesting a bullish momentum in the short term.
- EMA is also showing a positive trend, supporting the possibility of further price appreciation.
Momentum Indicators:
- RSI is in the neutral zone, indicating neither overbought nor oversold conditions.
- Stochastic oscillators suggest a bearish divergence, hinting at a possible short-term pullback.
- Williams %R is in the oversold territory, signaling a potential buying opportunity.
Volatility Indicators:
- Bollinger Bands are narrowing, indicating decreasing volatility and a possible period of consolidation.
- The lower Bollinger Band is moving closer to the price, suggesting a potential support level.
Volume Indicators:
- On-Balance Volume (OBV) is relatively stable, indicating no significant divergence between price and volume.
- Chaikin Money Flow (CMF) is positive, reflecting a slight inflow of money into the stock.
Key Observations:
- The stock is currently in a consolidation phase with a slight bullish bias based on trend indicators.
- Momentum indicators show mixed signals, with a neutral to slightly bearish outlook.
- Volatility is decreasing, indicating a potential period of price stabilization.
- Volume indicators suggest a lack of significant buying or selling pressure.
Conclusion:
Based on the analysis of technical indicators, the next few days for BSCW stock are likely to see sideways movement with a slight upward bias. The stock may consolidate within a narrow range as volatility decreases. Traders should watch for potential support at the lower Bollinger Band and consider buying opportunities when the price reaches oversold levels according to Williams %R. It is advisable to closely monitor the trend indicators for any signs of a confirmed uptrend or reversal.