Technical Analysis of BSEP 2024-05-10
Overview:
In analyzing the technical indicators for BSEP stock over the last 5 days, we will delve into the trend, momentum, volatility, and volume indicators to provide a comprehensive outlook on the possible stock price movement in the coming days. By examining these key indicators, we aim to offer valuable insights and predictions for potential investors.
Trend Indicators:
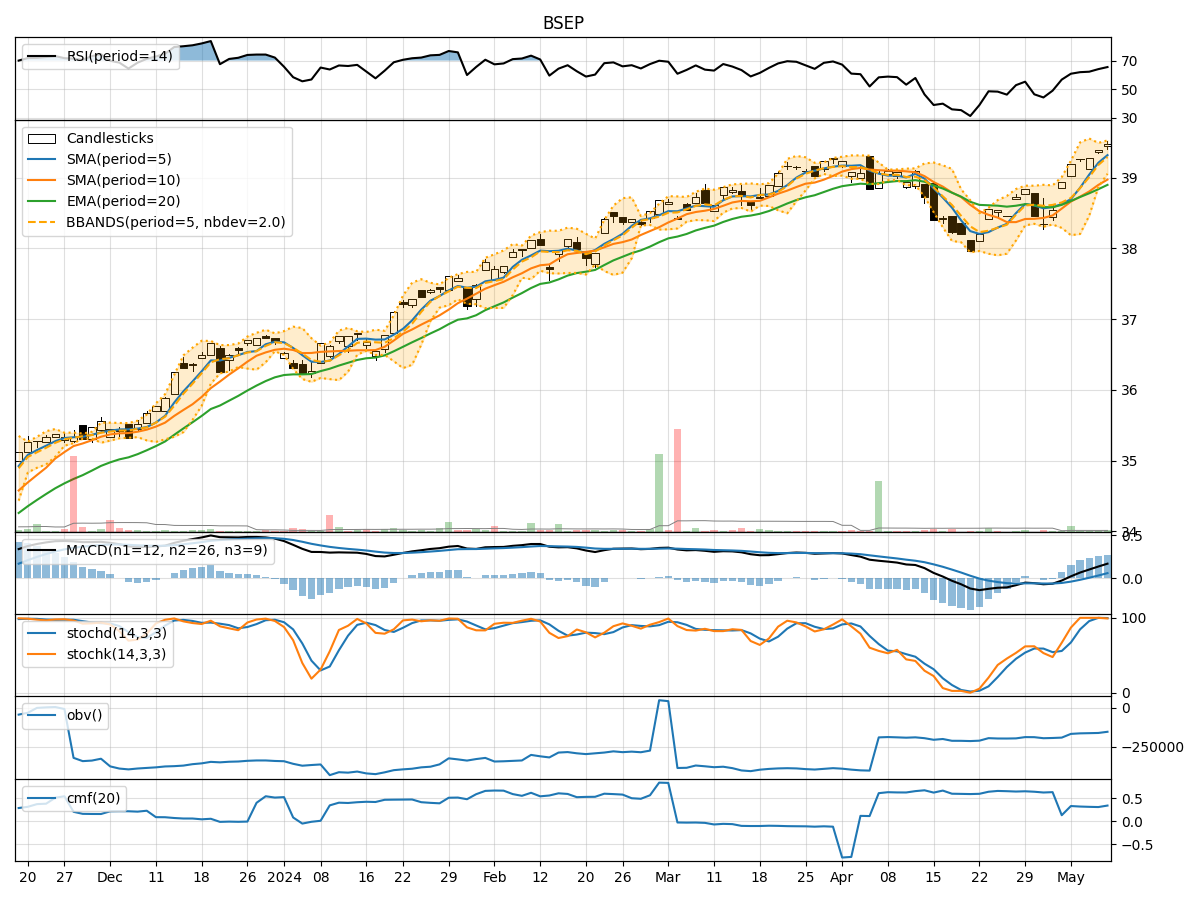
- Moving Averages (MA): The 5-day moving average has been consistently above the short-term (10-day) simple moving average, indicating a bullish trend.
- Exponential Moving Average (EMA): The EMA has been steadily increasing, reflecting positive price momentum.
- Moving Average Convergence Divergence (MACD): The MACD line has been above the signal line, suggesting bullish momentum.
- Conclusion: The trend indicators point towards an upward trend for BSEP stock.
Momentum Indicators:
- Relative Strength Index (RSI): The RSI has been increasing, indicating strengthening buying pressure.
- Stochastic Oscillator: Both %K and %D have been consistently high, signaling strong upward momentum.
- Williams %R (Willams %R): The Williams %R has been fluctuating but generally in the oversold territory.
- Conclusion: Momentum indicators suggest a bullish sentiment for BSEP stock.
Volatility Indicators:
- Bollinger Bands (BB): The stock price has been trading within the upper Bollinger Band, indicating increased volatility.
- Conclusion: Volatility indicators suggest a volatile trading environment for BSEP stock.
Volume Indicators:
- On-Balance Volume (OBV): The OBV has been steadily increasing, indicating accumulation by investors.
- Chaikin Money Flow (CMF): The CMF has been positive, reflecting buying pressure.
- Conclusion: Volume indicators point towards positive investor sentiment for BSEP stock.
Key Observations and Opinions:
- The trend and momentum indicators align in signaling an upward movement for BSEP stock.
- Volatility indicators suggest increased price fluctuations, which could present trading opportunities for short-term traders.
- Volume indicators indicate growing interest from investors, supporting the bullish outlook for the stock.
Conclusion:
Based on the analysis of the technical indicators across trend, momentum, volatility, and volume, the overall outlook for BSEP stock is bullish. Investors may consider buying positions in anticipation of further price appreciation. However, it is essential to monitor the market closely for any sudden changes in the indicators that could alter this outlook.