Technical Analysis of BSJP 2024-05-10
Overview:
In analyzing the technical indicators for BSJP stock over the last 5 days, we will delve into the trend, momentum, volatility, and volume indicators to provide a comprehensive outlook on the possible future stock price movement. By examining these key indicators, we aim to offer valuable insights and predictions for the upcoming trading days.
Trend Analysis:
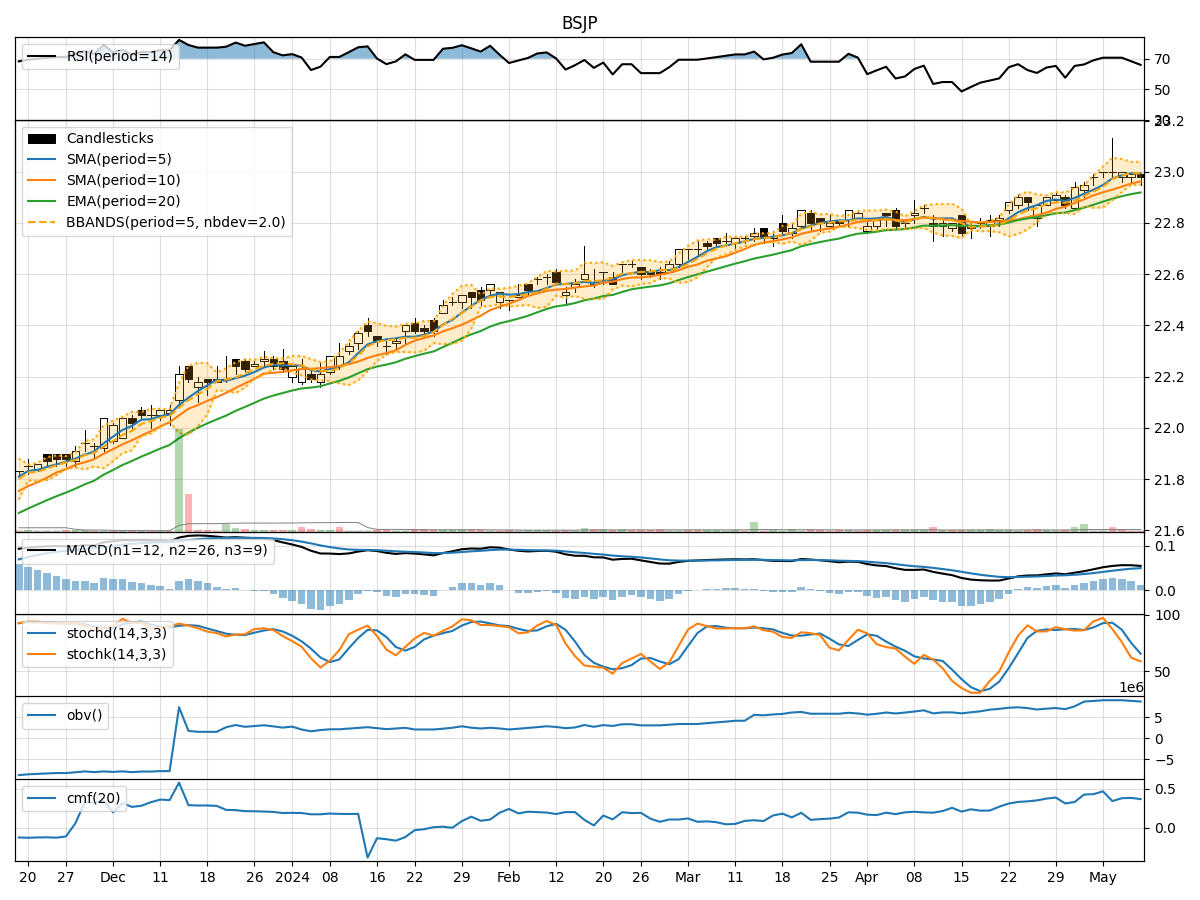
- Moving Averages (MA): The 5-day Moving Average (MA) has been relatively stable around $22.98-$23.00, indicating a sideways trend.
- MACD: The MACD line has shown a slight positive trend, with the MACD line consistently above the signal line, suggesting a potential bullish momentum.
- EMA: The Exponential Moving Average (EMA) has been gradually increasing, supporting the bullish sentiment.
Momentum Analysis:
- RSI: The Relative Strength Index (RSI) has been declining, indicating a weakening momentum but still within the neutral range.
- Stochastic Oscillator: Both %K and %D have been decreasing, signaling a potential bearish momentum.
- Williams %R: The Williams %R is in the oversold territory, suggesting a possible reversal or consolidation.
Volatility Analysis:
- Bollinger Bands: The Bollinger Bands have been narrowing, indicating decreasing volatility and a potential price breakout in the near future.
- Bollinger %B: The %B indicator is approaching the lower band, suggesting a possible oversold condition.
Volume Analysis:
- On-Balance Volume (OBV): The OBV has been declining, indicating selling pressure in the stock.
- Chaikin Money Flow (CMF): The CMF has been relatively stable, showing a neutral money flow trend.
Key Observations:
- The trend indicators suggest a sideways movement with a slight bullish bias.
- Momentum indicators point towards a weakening momentum and a potential bearish outlook.
- Volatility indicators indicate a decreasing volatility environment, possibly preceding a breakout.
- Volume indicators show selling pressure but with a neutral money flow sentiment.
Conclusion:
Based on the analysis of the technical indicators, the next few days for BSJP stock may see sideways consolidation with a slight bullish bias. However, caution is advised as the momentum is weakening, and there is a possibility of a bearish reversal. Traders should closely monitor the narrowing Bollinger Bands for a potential breakout signal and watch for any reversal patterns in the momentum indicators. Overall, a cautious approach with proper risk management is recommended in the current market scenario.