Technical Analysis of BSJQ 2024-05-10
Overview:
In analyzing the technical indicators for BSJQ stock over the last 5 days, we will delve into the trend, momentum, volatility, and volume indicators to provide a comprehensive outlook on the possible future stock price movement. By examining these key indicators, we aim to offer valuable insights and predictions for the upcoming trading days.
Trend Analysis:
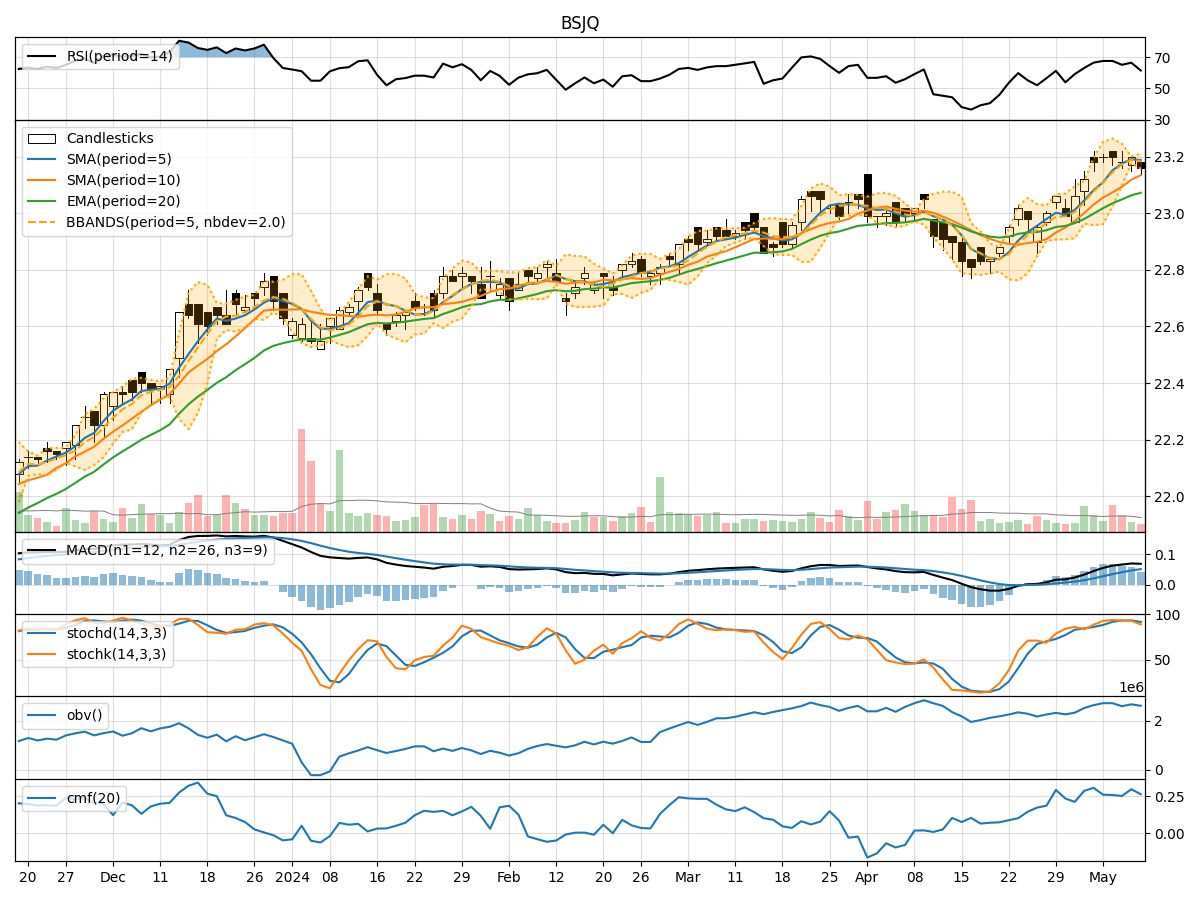
- Moving Averages (MA): The 5-day Moving Average (MA) has been relatively stable around the closing prices, indicating a consistent trend in the short term.
- MACD and Signal Line: The MACD line has been positive and increasing, suggesting bullish momentum in the stock price.
- Relative Strength Index (RSI): The RSI values have been fluctuating but generally staying within the neutral to slightly overbought territory.
Momentum Analysis:
- Stochastic Oscillator: The Stochastic Oscillator has shown some fluctuations but has generally been in the overbought region, indicating potential for a pullback.
- Williams %R (WillR): The Williams %R has been consistently in the oversold territory, signaling a potential reversal in the stock price.
Volatility Analysis:
- Bollinger Bands (BB): The Bollinger Bands have been relatively narrow, suggesting low volatility in the stock price.
- Bollinger Band %B (BBP): The %B indicator has been hovering around the midline, indicating a balanced market sentiment.
Volume Analysis:
- On-Balance Volume (OBV): The OBV has shown some fluctuations but has not exhibited a clear trend, indicating mixed buying and selling pressure.
- Chaikin Money Flow (CMF): The CMF has been positive, suggesting that money flow into the stock has been relatively strong.
Key Observations:
- The trend indicators suggest a bullish sentiment in the short term, supported by the positive MACD and stable MA.
- Momentum indicators show mixed signals, with the Stochastic Oscillator hinting at a potential pullback while the Williams %R indicates a reversal.
- Volatility remains low based on the Bollinger Bands, indicating a lack of significant price fluctuations.
- Volume indicators show mixed signals, with OBV fluctuating and CMF indicating positive money flow into the stock.
Conclusion:
Based on the analysis of the technical indicators, the stock price of BSJQ is likely to experience further upward movement in the next few trading days. The bullish trend indicated by the MACD and stable MA, coupled with positive money flow suggested by the CMF, support this outlook. However, caution is advised due to the mixed signals from momentum indicators like the Stochastic Oscillator and Williams %R. Overall, the stock is expected to continue its upward trajectory with potential minor pullbacks along the way.