Technical Analysis of BSJT 2024-05-10
Overview:
In analyzing the technical indicators for BSJT stock over the last 5 days, we will delve into the trend, momentum, volatility, and volume indicators to provide a comprehensive outlook on the possible future stock price movement. By examining these key indicators, we aim to offer valuable insights and predictions for the upcoming trading days.
Trend Analysis:
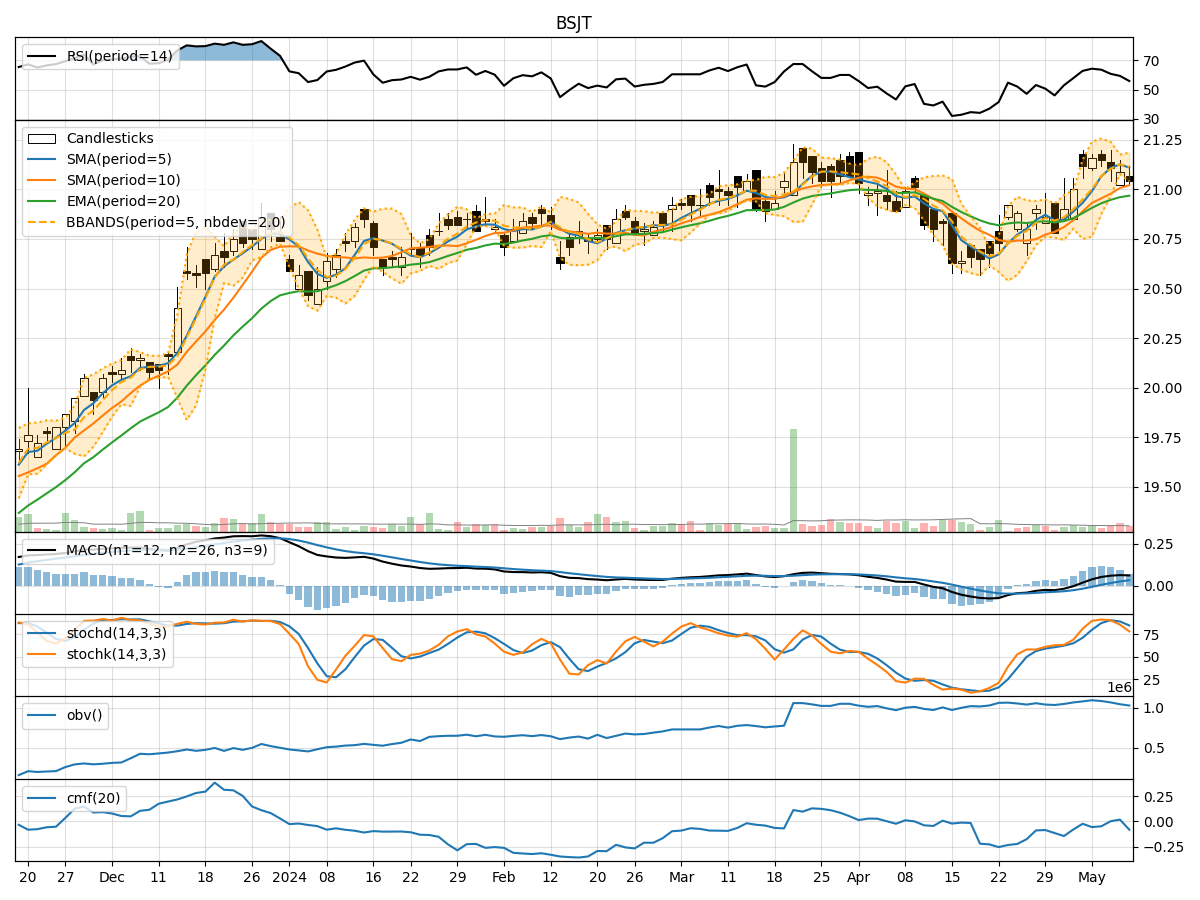
- Moving Averages (MA): The 5-day Moving Average (MA) has been relatively stable around the closing prices, indicating a consistent trend.
- MACD: The Moving Average Convergence Divergence (MACD) has shown positive values, suggesting a bullish momentum in the short term.
- EMA: The Exponential Moving Average (EMA) has been trending slightly upwards, reflecting a positive sentiment in the market.
Key Observation: The trend indicators point towards a bullish outlook for the stock in the near future.
Momentum Analysis:
- RSI: The Relative Strength Index (RSI) has been fluctuating around the mid-level, indicating a balanced momentum.
- Stochastic Oscillator: Both %K and %D values have been declining, signaling a potential weakening momentum.
- Williams %R: The Williams %R is in the oversold territory, suggesting a possible reversal in momentum.
Key Observation: The momentum indicators suggest a neutral to slightly bearish sentiment for the stock in the upcoming days.
Volatility Analysis:
- Bollinger Bands: The Bollinger Bands have been narrowing, indicating decreasing volatility in the stock price.
- Bollinger %B: The %B value has been hovering around the middle range, reflecting a balanced volatility level.
Key Observation: Volatility indicators imply a consolidation phase in the stock price movement.
Volume Analysis:
- On-Balance Volume (OBV): The OBV has shown a slight decrease, suggesting a potential distribution phase.
- Chaikin Money Flow (CMF): The CMF has been fluctuating around the zero line, indicating a balance between buying and selling pressure.
Key Observation: Volume indicators point towards a neutral stance in terms of market participation.
Conclusion:
Based on the analysis of the technical indicators, the next few days for BSJT stock are likely to see a bullish trend continuation supported by the positive trend indicators. However, the momentum indicators suggest a potential short-term bearish pullback before resuming the upward trajectory. The volatility indicators indicate a consolidation phase in the stock price, while volume indicators reflect a neutral market sentiment.
In conclusion, while short-term fluctuations may occur, the overall outlook for BSJT stock remains bullish with a potential for a resumption of the uptrend in the coming days. Investors should monitor the momentum indicators closely for any signs of a reversal and adjust their strategies accordingly.