Technical Analysis of BSMC 2024-05-10
Overview:
In analyzing the technical indicators for BSMC over the last 5 days, we will delve into the trends, momentum, volatility, and volume indicators to provide a comprehensive outlook on the possible stock price movement in the coming days. By examining key metrics such as moving averages, MACD, RSI, Bollinger Bands, and OBV, we aim to offer valuable insights and recommendations for potential investors.
Trend Indicators:
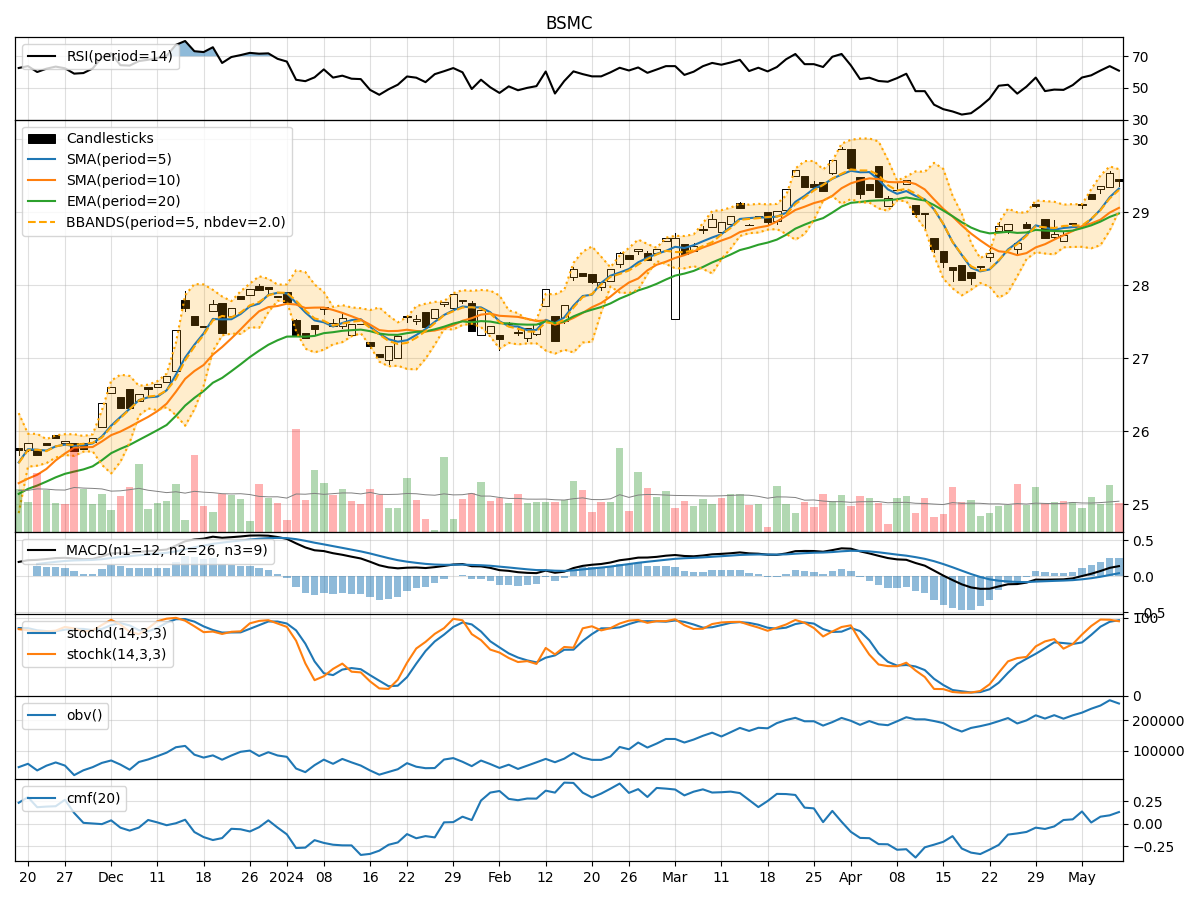
- Moving Averages (MA): The 5-day MA has been consistently above the closing prices, indicating a short-term uptrend.
- MACD: The MACD line has been trending upwards, with the MACD histogram showing positive values, suggesting bullish momentum.
- EMA: The EMA has been steadily increasing, supporting the bullish sentiment in the short to medium term.
Momentum Indicators:
- RSI: The RSI has been in the neutral to slightly overbought territory, suggesting a balanced momentum.
- Stochastic Oscillator: Both %K and %D have been in the overbought zone, indicating potential for a pullback.
- Williams %R: The Williams %R is in the oversold region, signaling a possible reversal in the short term.
Volatility Indicators:
- Bollinger Bands: The stock price has been trading within the bands, indicating normal volatility.
- Bollinger %B: The %B indicator is below 1, suggesting the stock is trading below the upper band, potentially indicating a buying opportunity.
- Bollinger Bandwidth: The bandwidth has been relatively stable, indicating consistent volatility levels.
Volume Indicators:
- On-Balance Volume (OBV): The OBV has been trending upwards, indicating accumulation by investors.
- Chaikin Money Flow (CMF): The CMF has been positive, suggesting buying pressure in the stock.
Key Observations and Opinions:
- Trend: The stock is in an upward trend based on moving averages and MACD.
- Momentum: The momentum indicators suggest a mixed outlook, with potential for a short-term pullback.
- Volatility: Volatility levels are stable, with no significant spikes or drops.
- Volume: Accumulation is evident based on OBV and CMF, indicating positive investor sentiment.
Conclusion:
Based on the analysis of the technical indicators, the next few days' possible stock price movement for BSMC is likely to be upward with a potential for a short-term pullback due to overbought conditions in the momentum indicators. Investors should consider entering positions on pullbacks for a favorable risk-reward ratio. Overall, the bullish trend supported by positive volume indicators suggests a favorable outlook for BSMC in the near term.