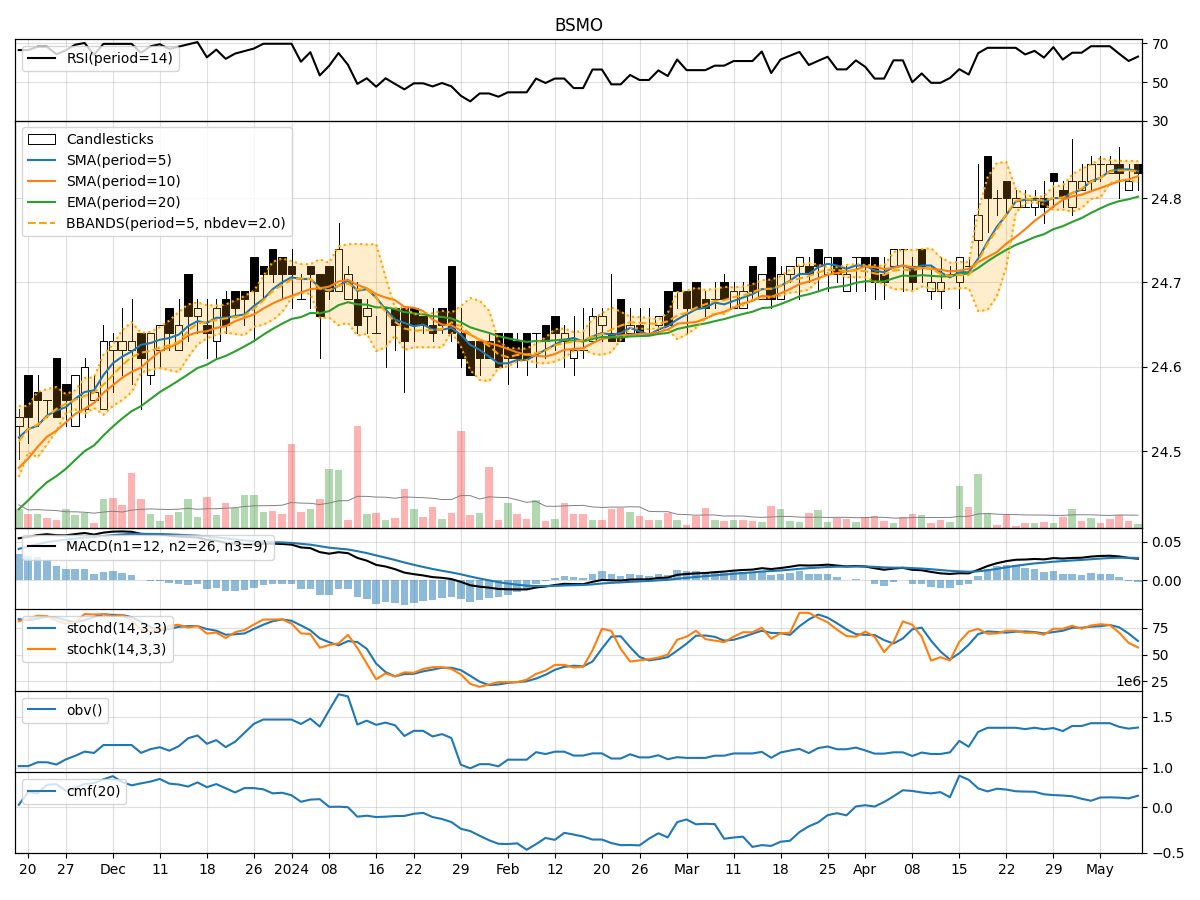
Technical Analysis of BSMO 2024-05-10
Overview:
In analyzing the technical indicators for BSMO over the last 5 days, we will delve into the trend, momentum, volatility, and volume indicators to provide a comprehensive outlook on the possible stock price movement in the coming days. By examining these key aspects, we aim to offer valuable insights and predictions to guide your investment decisions.
Trend Analysis:
- Moving Averages (MA): The 5-day MA has been relatively stable around the current stock price, indicating a neutral trend.
- MACD: The MACD line has been fluctuating around the signal line, suggesting a lack of strong momentum in either direction.
- RSI: The RSI has been oscillating in the neutral zone, reflecting a balanced buying and selling pressure.
Key Observation: The trend indicators show a lack of clear direction, signaling a period of consolidation.
Momentum Analysis:
- Stochastic Oscillator: The Stochastic Oscillator has been declining, indicating a potential bearish momentum.
- Williams %R (WillR): The WillR is hovering around oversold levels, suggesting a possible reversal in the short term.
Key Observation: Momentum indicators point towards a bearish sentiment in the near future.
Volatility Analysis:
- Bollinger Bands (BB): The narrowing of the Bollinger Bands suggests decreasing volatility and a potential period of consolidation.
- Bollinger %B (BBP): The %B indicator is fluctuating within a tight range, further supporting the consolidation view.
Key Observation: Volatility indicators indicate a period of low volatility and potential price stabilization.
Volume Analysis:
- On-Balance Volume (OBV): The OBV has been relatively flat, indicating a balance between buying and selling pressure.
- Chaikin Money Flow (CMF): The CMF is positive but has not shown significant strength, reflecting a neutral volume trend.
Key Observation: Volume indicators suggest a lack of strong buying or selling pressure.
Conclusion:
Based on the analysis of trend, momentum, volatility, and volume indicators, the overall outlook for BSMO in the next few days leans towards a sideways movement with a slight bearish bias. The lack of clear trend direction, coupled with decreasing volatility and neutral volume signals, indicates a period of consolidation where the stock price is likely to trade within a narrow range.
Key Conclusion: Expect BSMO to consolidate in the near term with a potential downward bias. It is advisable to closely monitor key support and resistance levels for potential breakout opportunities.
By considering these technical indicators and their implications, investors can make informed decisions aligned with the current market dynamics and trends.