Technical Analysis of BSMR 2024-05-10
Overview:
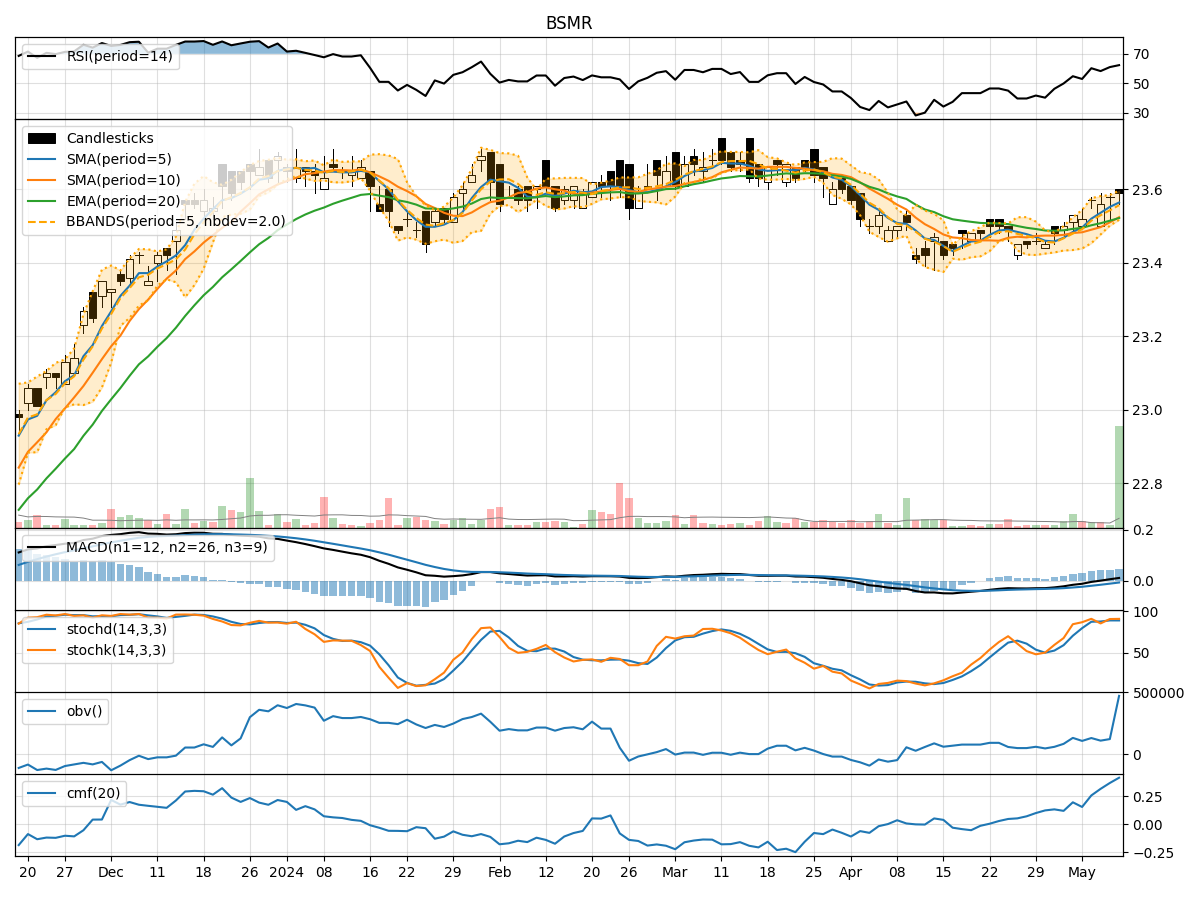
In the last 5 days, the stock has shown a relatively stable price movement with slight fluctuations. The trend indicators suggest a gradual uptrend, supported by the moving averages and MACD. Momentum indicators indicate a strengthening momentum, with RSI showing a positive trend. Volatility indicators show a narrowing Bollinger Bands, indicating decreasing volatility. Volume indicators suggest a recent increase in buying pressure.
Trend Indicators Analysis:
- Moving Averages (MA): The 5-day MA is consistently above the 10-day SMA, indicating a short-term bullish trend.
- MACD: The MACD line is above the signal line, indicating a bullish momentum.
- EMA: The EMA is trending upwards, supporting the bullish sentiment.
Momentum Indicators Analysis:
- RSI: The RSI is in the neutral zone, indicating potential for further upside.
- Stochastic Oscillator: Both %K and %D are in overbought territory, suggesting a potential pullback.
- Williams %R: The stock is currently oversold, indicating a potential reversal.
Volatility Indicators Analysis:
- Bollinger Bands: The narrowing of the bands suggests decreasing volatility and a potential breakout.
- Bollinger %B: The %B is below 1, indicating the stock is trading below the lower band.
Volume Indicators Analysis:
- On-Balance Volume (OBV): The recent increase in OBV suggests accumulation by investors.
- Chaikin Money Flow (CMF): The CMF is positive, indicating buying pressure.
Key Observations:
- The stock is in an upward trend based on moving averages and MACD.
- Momentum indicators suggest a mixed signal with RSI neutral but stochastic indicators showing overbought conditions.
- Volatility is decreasing, indicating a potential period of consolidation.
- Recent buying pressure is evident from the volume indicators.
Conclusion:
Based on the analysis of technical indicators, the next few days may see the stock price experiencing consolidation or a slight pullback due to overbought conditions in the stochastic oscillator. However, the overall trend remains bullish supported by moving averages and MACD. Traders should watch for a potential breakout as volatility decreases, and monitor volume for confirmation of buying interest. Exercise caution in the short term due to the mixed signals from momentum indicators.