Technical Analysis of BSMS 2024-05-10
Overview:
In the last 5 trading days, the stock has shown a relatively stable price movement with minor fluctuations. The technical indicators provide insights into the trend, momentum, volatility, and volume of the stock. By analyzing these indicators, we can make informed predictions about the possible future price movement of the stock.
Trend Analysis:
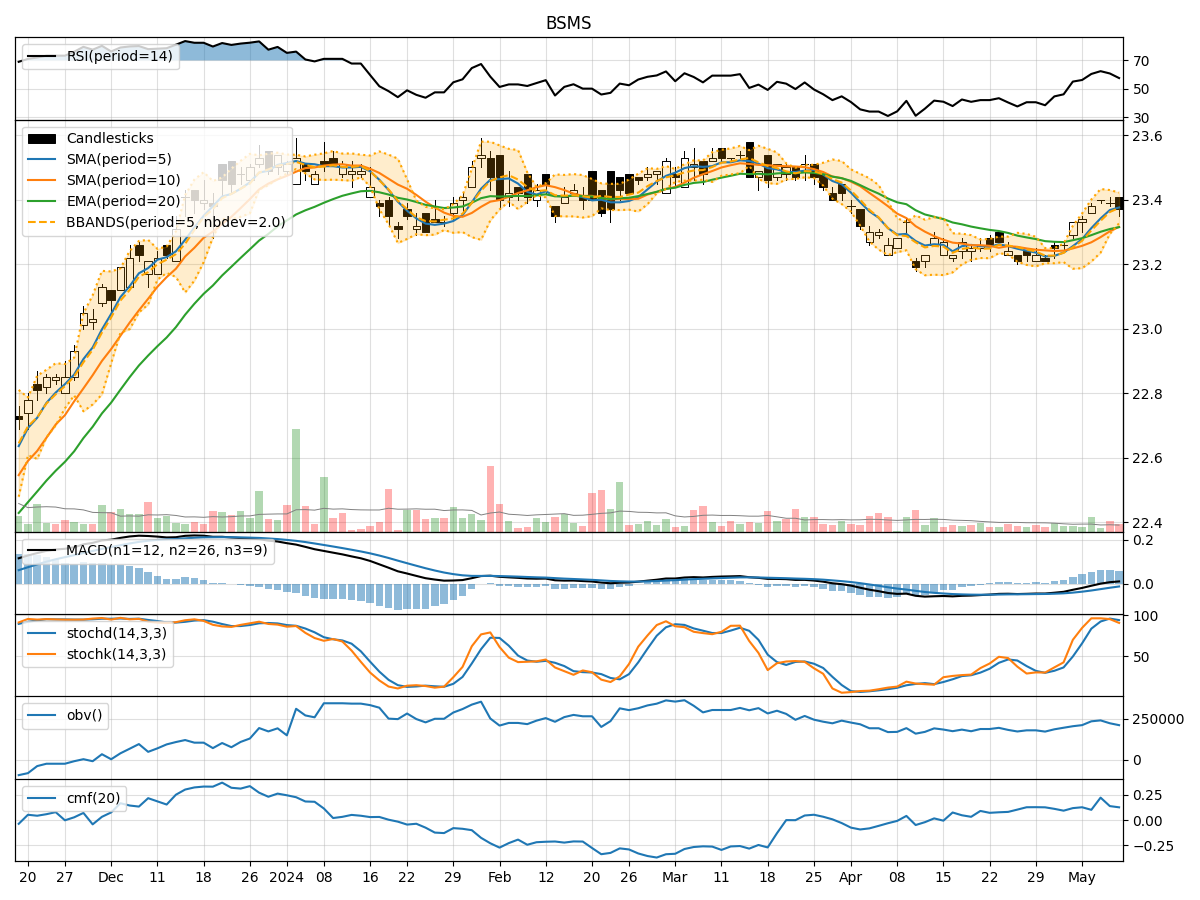
- Moving Averages (MA): The 5-day Moving Average (MA) has been consistently above the Simple Moving Average (SMA) and Exponential Moving Average (EMA), indicating a short-term uptrend.
- MACD: The MACD line has been consistently above the Signal line, suggesting a bullish momentum in the stock price.
- MACD Histogram: The MACD Histogram has been increasing, indicating strengthening bullish momentum.
Momentum Analysis:
- RSI: The Relative Strength Index (RSI) has been fluctuating around the 60-65 range, indicating a neutral momentum.
- Stochastic Oscillator: Both %K and %D lines of the Stochastic Oscillator have been in the overbought zone, suggesting a potential reversal or consolidation.
- Williams %R: The Williams %R is in the oversold territory, indicating a potential buying opportunity.
Volatility Analysis:
- Bollinger Bands (BB): The stock price has been trading within the Bollinger Bands, with the bands narrowing, suggesting decreasing volatility.
- Bollinger %B: The %B indicator is below 1, indicating the price is below the upper band, potentially signaling a reversal or consolidation.
Volume Analysis:
- On-Balance Volume (OBV): The OBV has shown mixed signals with fluctuations, indicating indecision among investors.
- Chaikin Money Flow (CMF): The CMF has been relatively stable around 0.1-0.22, suggesting a neutral sentiment regarding money flow.
Conclusion:
Based on the analysis of the technical indicators: - Trend: The stock is currently in an upward trend supported by the moving averages and MACD. - Momentum: The momentum indicators suggest a neutral to slightly bearish sentiment due to overbought conditions in the Stochastic Oscillator. - Volatility: Volatility is decreasing, indicating a potential period of consolidation or a minor pullback. - Volume: The volume indicators show mixed signals, reflecting uncertainty among market participants.
Future Price Movement Prediction:
Considering the overall analysis, the stock is likely to experience a short-term consolidation or a minor pullback in the next few days. Investors should closely monitor the Stochastic Oscillator for a potential reversal signal and watch for any breakout or breakdown from the Bollinger Bands for confirmation of the next price direction. It is advisable to exercise caution and wait for clearer signals before making any significant trading decisions.