Technical Analysis of BSMT 2024-05-10
Overview:
In analyzing the technical indicators for BSMT over the last 5 days, we will delve into the trend, momentum, volatility, and volume indicators to provide a comprehensive outlook on the possible stock price movement. By examining these key indicators, we aim to offer valuable insights and predictions for the upcoming trading days.
Trend Analysis:
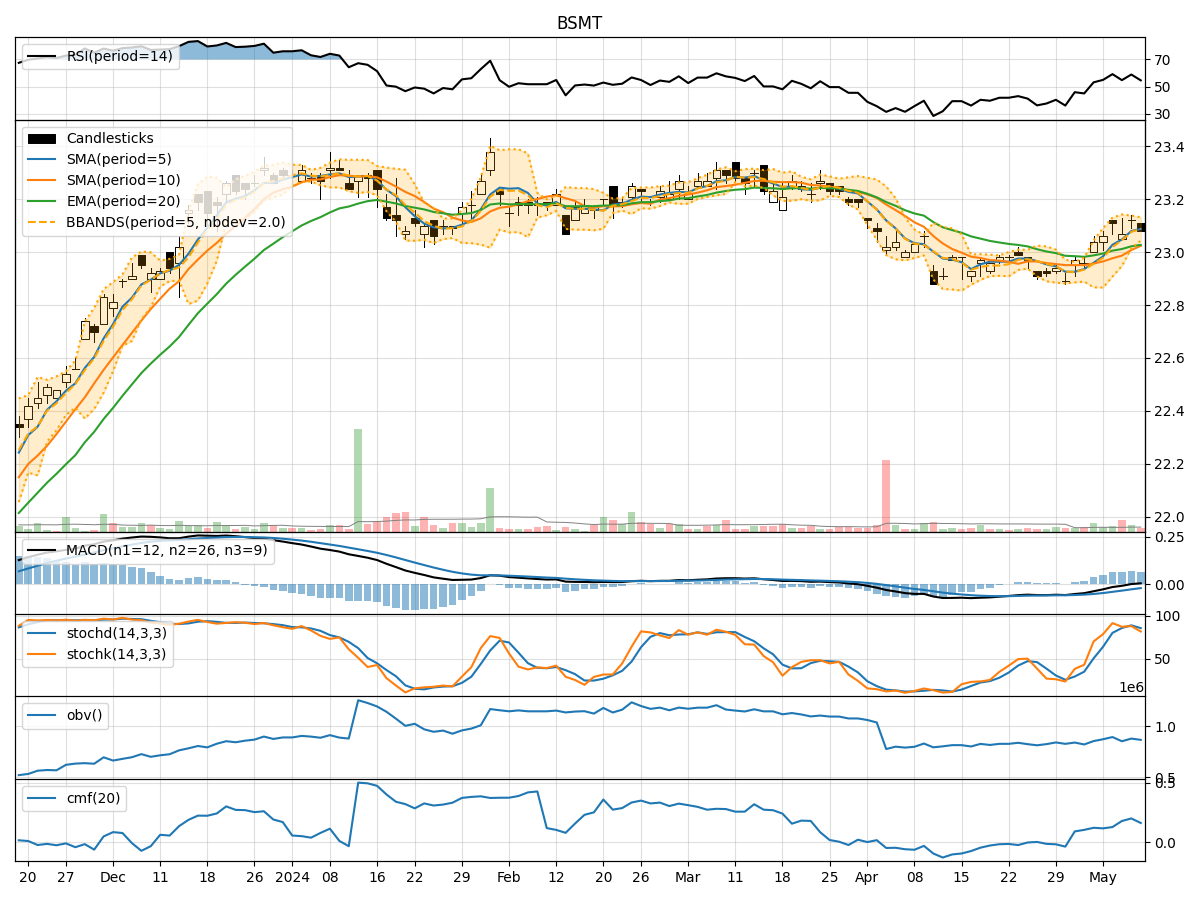
- Moving Averages (MA): The 5-day Moving Average (MA) has been relatively stable around the current price, indicating a neutral trend.
- MACD: The MACD line has been consistently above the signal line, suggesting a bullish momentum.
- RSI: The Relative Strength Index (RSI) has been fluctuating around the neutral zone, indicating indecision in the market sentiment.
Momentum Analysis:
- Stochastic Oscillator: The Stochastic Oscillator has shown fluctuations but remains in the overbought territory, signaling potential overvaluation.
- Williams %R: The Williams %R indicator has been hovering in the oversold region, suggesting a possible reversal in the short term.
Volatility Analysis:
- Bollinger Bands: The Bollinger Bands have been narrowing, indicating decreasing volatility and a potential breakout in the near future.
Volume Analysis:
- On-Balance Volume (OBV): The OBV has shown mixed signals, reflecting uncertainty in the accumulation/distribution of the stock.
- Chaikin Money Flow (CMF): The CMF has been positive, indicating buying pressure in the market.
Key Observations:
- The trend indicators suggest a neutral to slightly bullish outlook.
- Momentum indicators show conflicting signals with overbought and oversold conditions.
- Volatility is decreasing, hinting at a potential price breakout.
- Volume indicators reflect mixed signals with no clear direction.
Conclusion:
Based on the analysis of the technical indicators, the next few days for BSMT could see sideways consolidation with potential bullish bias. Traders should closely monitor the price action for any breakout above the current range. It is advisable to wait for confirmation from multiple indicators before making significant trading decisions.