Technical Analysis of BSMW 2024-05-10
Overview:
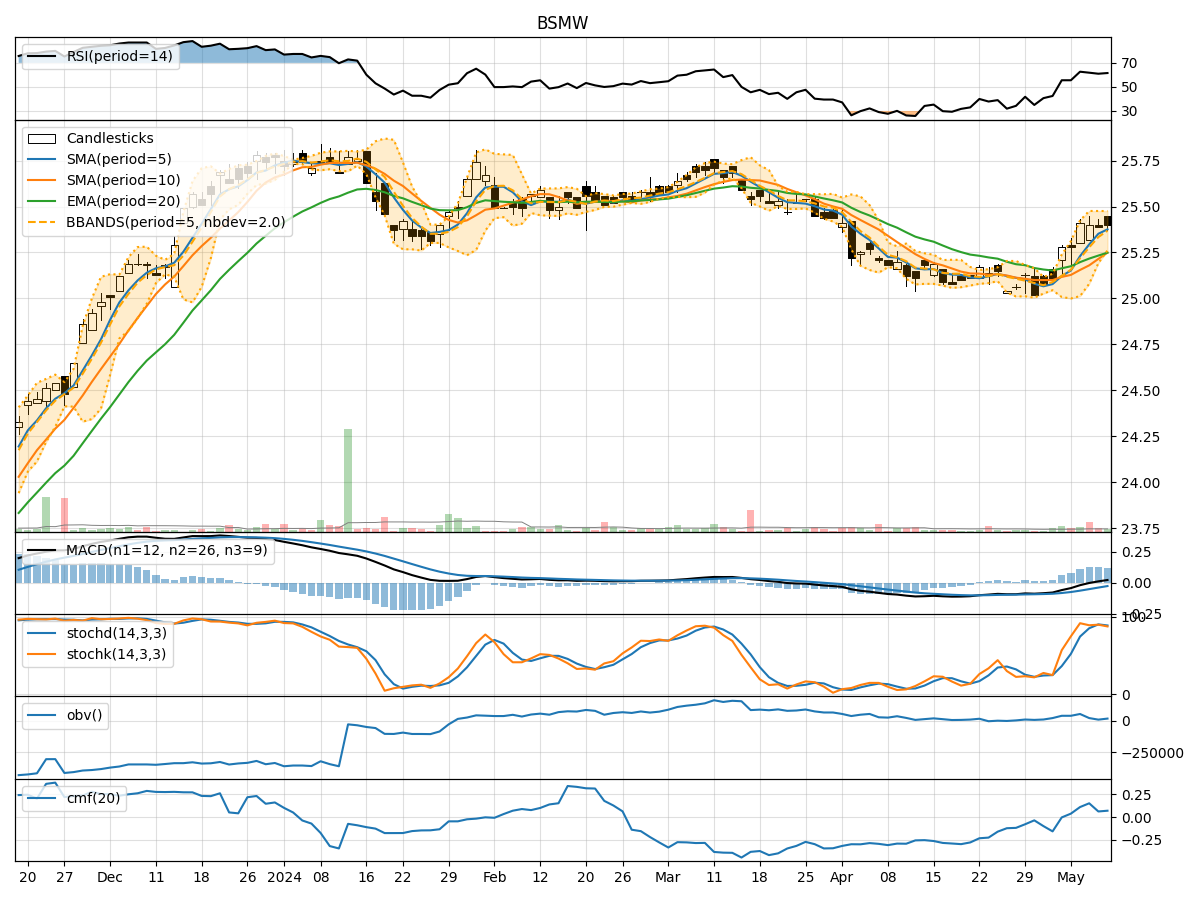
In analyzing the technical indicators for BSMW stock over the last 5 days, we will delve into the trend, momentum, volatility, and volume indicators to provide a comprehensive outlook on the possible future stock price movement. By examining these key indicators, we aim to offer valuable insights and predictions for the upcoming trading days.
Trend Analysis:
- Moving Averages (MA): The 5-day Moving Average (MA) has been consistently above the Simple Moving Average (SMA) and Exponential Moving Average (EMA), indicating a short-term bullish trend.
- MACD: The MACD line has been consistently above the signal line, suggesting a bullish momentum in the stock price.
Momentum Analysis:
- RSI: The Relative Strength Index (RSI) has been hovering around the 60-65 range, indicating a neutral momentum in the stock.
- Stochastic Oscillator: Both %K and %D lines of the Stochastic Oscillator have been fluctuating in the overbought territory, suggesting a potential reversal or consolidation phase.
Volatility Analysis:
- Bollinger Bands (BB): The stock price has been trading within the Bollinger Bands, with the bands narrowing, indicating decreasing volatility.
Volume Analysis:
- On-Balance Volume (OBV): The OBV has shown mixed signals with fluctuations in volume, suggesting indecision among market participants.
- Chaikin Money Flow (CMF): The CMF has been positive but relatively low, indicating some buying pressure but not significant.
Key Observations:
- The trend indicators suggest a bullish sentiment in the short term.
- Momentum indicators show a neutral stance with potential signs of overbought conditions.
- Volatility has been decreasing, indicating a possible period of consolidation.
- Volume indicators reflect mixed signals, pointing towards uncertainty in market participation.
Conclusion:
Based on the analysis of the technical indicators, the next few days for BSMW stock could see sideways movement with a slight bullish bias. Traders should exercise caution due to the mixed signals from volume indicators and the potential overbought conditions indicated by the Stochastic Oscillator. It is advisable to closely monitor the price action and key support/resistance levels for better decision-making.