Technical Analysis of BTEC 2024-05-10
Overview:
In analyzing the technical indicators for BTEC over the last 5 days, we will delve into the trend, momentum, volatility, and volume indicators to provide a comprehensive outlook on the possible stock price movement. By examining these key aspects, we aim to offer valuable insights and predictions for the upcoming days.
Trend Analysis:
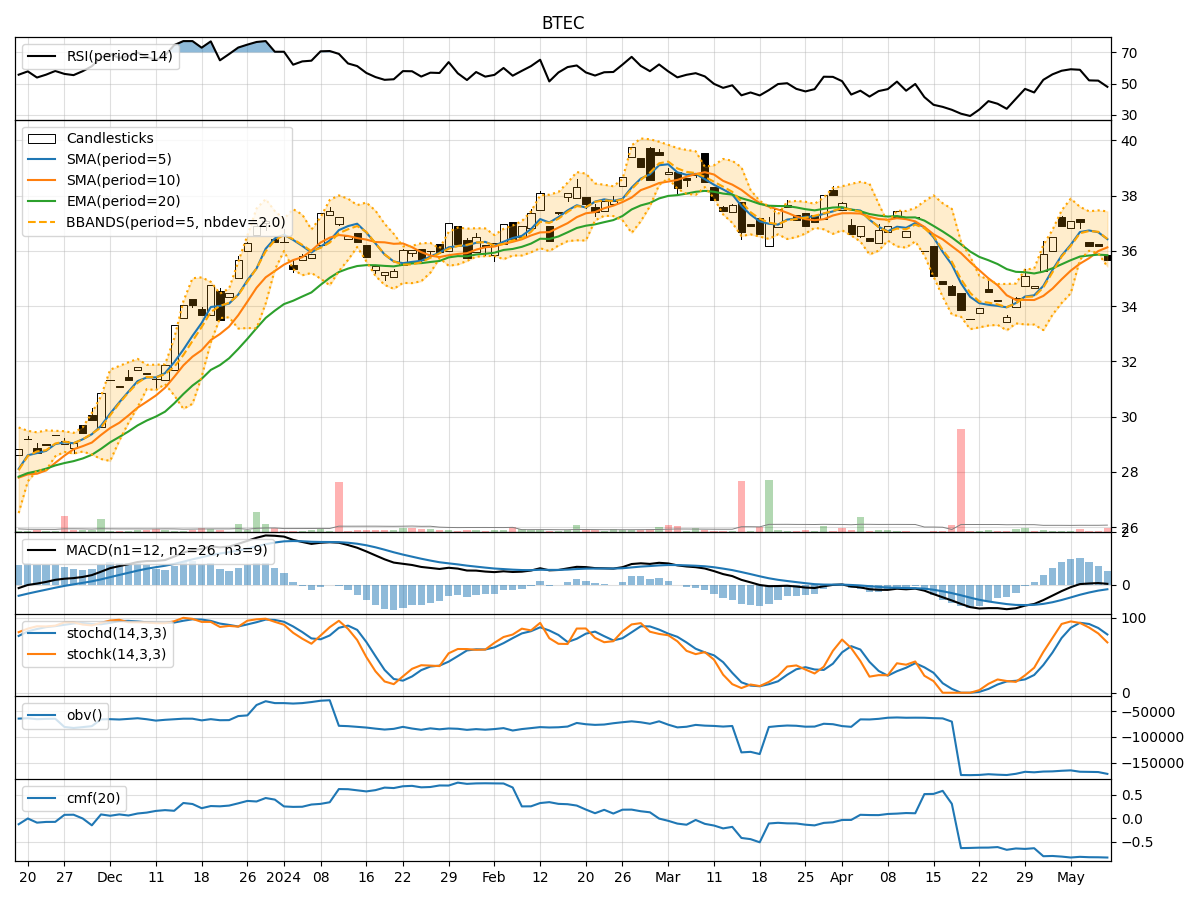
- Moving Averages (MA): The 5-day Moving Average (MA) has been fluctuating around the 36.2 level, indicating a relatively stable trend in the short term.
- MACD: The Moving Average Convergence Divergence (MACD) has shown a slight positive trend, with the MACD line moving above the signal line in recent days.
- EMA: The Exponential Moving Average (EMA) has been gradually increasing, suggesting a bullish sentiment in the longer term.
Momentum Analysis:
- RSI: The Relative Strength Index (RSI) has been hovering around the mid-level, indicating a neutral momentum in the stock.
- Stochastic Oscillator: Both %K and %D of the Stochastic Oscillator have been declining, signaling a potential bearish momentum.
- Williams %R: The Williams %R indicator has been in the oversold territory, suggesting a possible reversal in the short term.
Volatility Analysis:
- Bollinger Bands: The Bollinger Bands have been narrowing, indicating decreasing volatility in the stock price.
- Bollinger %B: The %B indicator has been relatively low, suggesting a potential buying opportunity as the stock may be oversold.
Volume Analysis:
- On-Balance Volume (OBV): The OBV has been declining, indicating a decrease in buying pressure over the last few days.
- Chaikin Money Flow (CMF): The CMF has been negative, reflecting a bearish sentiment in the stock.
Key Observations:
- The trend indicators show a mixed outlook with a slightly bullish bias in the longer term.
- Momentum indicators suggest a neutral to bearish momentum in the stock.
- Volatility indicators point towards decreasing volatility and a potential buying opportunity.
- Volume indicators indicate a decrease in buying pressure and a bearish sentiment.
Conclusion:
Based on the analysis of the technical indicators, the next few days' possible stock price movement for BTEC is likely to be sideways with a slight bearish bias. Traders and investors should exercise caution and consider waiting for clearer signals before making significant trading decisions. It is advisable to monitor key support and resistance levels closely to gauge the stock's direction accurately.