Technical Analysis of BTF 2024-05-10
Overview:
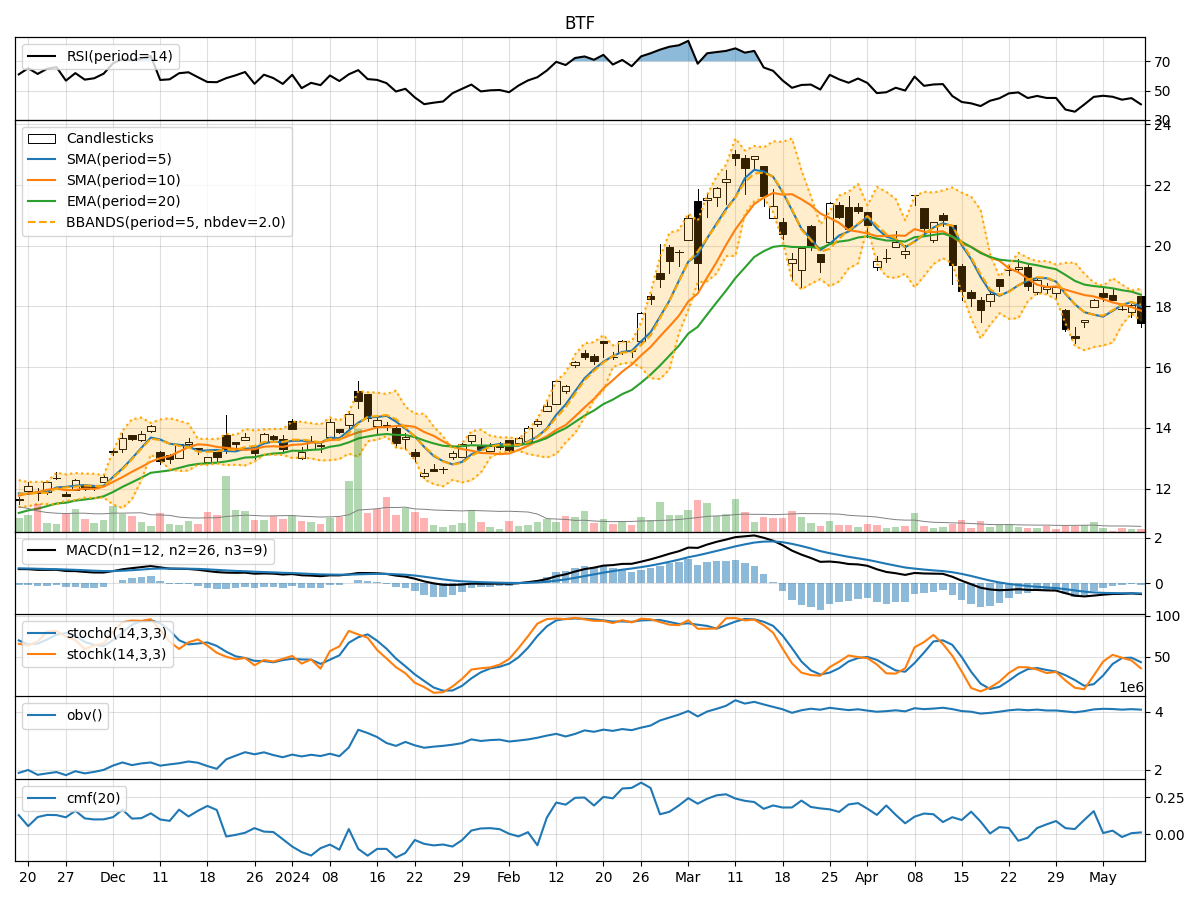
In analyzing the technical indicators for BTF stock over the last 5 days, we will delve into the trend, momentum, volatility, and volume indicators to provide a comprehensive outlook on the possible stock price movement in the coming days. By examining these key indicators, we aim to offer valuable insights and predictions for potential investors.
Trend Analysis:
- Moving Averages (MA): The 5-day Moving Average (MA) has been fluctuating around the closing prices, indicating short-term price trends. The Simple Moving Average (SMA) and Exponential Moving Average (EMA) show a downward trend, suggesting a bearish sentiment in the market.
- MACD: The Moving Average Convergence Divergence (MACD) line has been consistently below the signal line, indicating a bearish trend in the stock price.
- Conclusion: The trend indicators suggest a bearish outlook for BTF stock in the near term.
Momentum Analysis:
- RSI: The Relative Strength Index (RSI) has been hovering around the 40-50 range, indicating a neutral momentum in the stock price.
- Stochastic Oscillator: Both %K and %D lines of the Stochastic Oscillator are below 50, suggesting a bearish momentum.
- Conclusion: The momentum indicators reflect a neutral to bearish sentiment for BTF stock.
Volatility Analysis:
- Bollinger Bands (BB): The Bollinger Bands show a narrowing of the bands, indicating decreasing volatility in the stock price.
- Conclusion: The volatility indicators suggest a decreasing volatility environment for BTF stock.
Volume Analysis:
- On-Balance Volume (OBV): The OBV has been relatively stable over the past 5 days, indicating a balance between buying and selling pressure.
- Chaikin Money Flow (CMF): The CMF is slightly positive, suggesting a slight inflow of money into the stock.
- Conclusion: The volume indicators imply a neutral volume trend for BTF stock.
Overall Conclusion:
Based on the analysis of trend, momentum, volatility, and volume indicators, the overall outlook for BTF stock in the next few days is bearish. The trend indicators point towards a downward trajectory, supported by the bearish momentum and decreasing volatility. Although the volume remains neutral, the overall technical analysis signals a potential decline in the stock price.
Recommendation:
Considering the bearish trend and momentum, investors may consider short-term selling or wait for a better entry point before considering a long position. It is essential to monitor the price action closely and set stop-loss levels to manage risk effectively. Additionally, fundamental analysis should be conducted to complement the technical analysis for a well-rounded investment decision.
By combining technical analysis with market insights, investors can make informed decisions and navigate the dynamic stock market landscape effectively.