Technical Analysis of BTOP 2024-05-10
Overview:
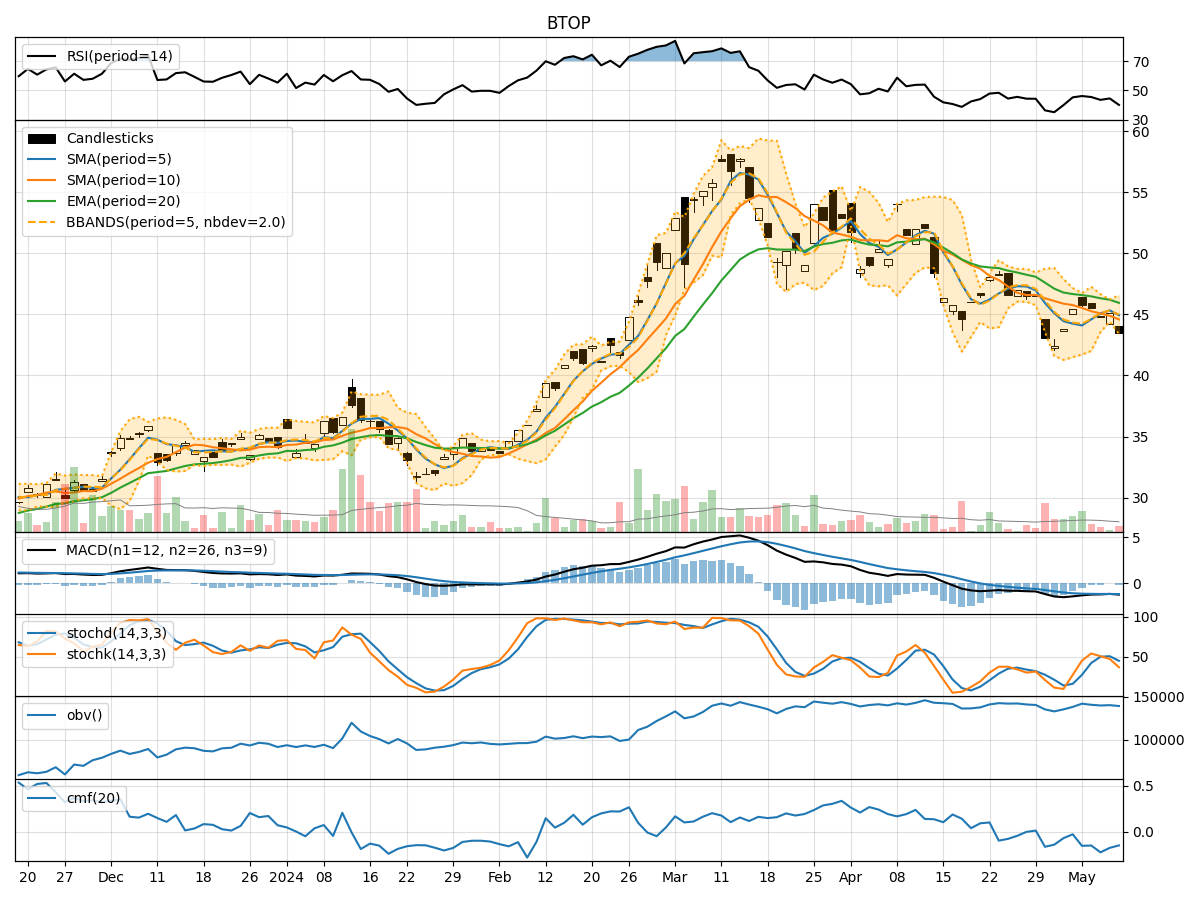
In analyzing the technical indicators for BTOP over the last 5 days, we will delve into the trend, momentum, volatility, and volume indicators to provide a comprehensive assessment of the stock's potential price movement. By examining these key factors, we aim to offer valuable insights and predictions for the upcoming days.
Trend Analysis:
- Moving Averages (MA): The 5-day Moving Average (MA) has been fluctuating around the closing prices, indicating short-term price trends. The Simple Moving Average (SMA) and Exponential Moving Average (EMA) show a downward trend, suggesting a bearish sentiment in the market.
- MACD: The Moving Average Convergence Divergence (MACD) and its signal line (MACDH) have been consistently negative, indicating a bearish momentum in the stock price.
Momentum Analysis:
- RSI: The Relative Strength Index (RSI) has been declining, indicating weakening momentum and potential oversold conditions.
- Stochastic Oscillator: Both %K and %D lines of the Stochastic Oscillator are trending downwards, suggesting a bearish momentum.
- Williams %R: The Williams %R is in the oversold territory, indicating a potential reversal or bounce in the stock price.
Volatility Analysis:
- Bollinger Bands (BB): The Bollinger Bands are narrowing, indicating decreasing volatility in the stock price. The bands are currently close to the lower band, suggesting a potential rebound or consolidation phase.
Volume Analysis:
- On-Balance Volume (OBV): The OBV has been declining, indicating selling pressure and potential bearish sentiment among investors.
- Chaikin Money Flow (CMF): The CMF is negative, reflecting a lack of buying pressure and potential outflow of money from the stock.
Key Observations:
- The trend indicators, momentum oscillators, and volume indicators collectively suggest a bearish outlook for BTOP in the short term.
- The narrowing Bollinger Bands and oversold conditions in momentum indicators may indicate a potential reversal or consolidation phase.
- The declining OBV and negative CMF signal a lack of buying interest and potential further downside in the stock price.
Conclusion:
Based on the analysis of the technical indicators, the next few days' possible stock price movement for BTOP is likely to be downward. The bearish trend, negative momentum, and lack of buying interest indicate a potential continuation of the current downtrend. Traders and investors should exercise caution and consider short-term selling strategies or wait for a clear reversal signal before considering long positions.