Technical Analysis of BUCK 2024-05-10
Overview:
In analyzing the technical indicators for BUCK stock over the last 5 days, we will delve into the trend, momentum, volatility, and volume indicators to provide a comprehensive outlook on the possible stock price movement in the coming days. By examining these key indicators, we aim to offer valuable insights and predictions to guide investment decisions.
Trend Analysis:
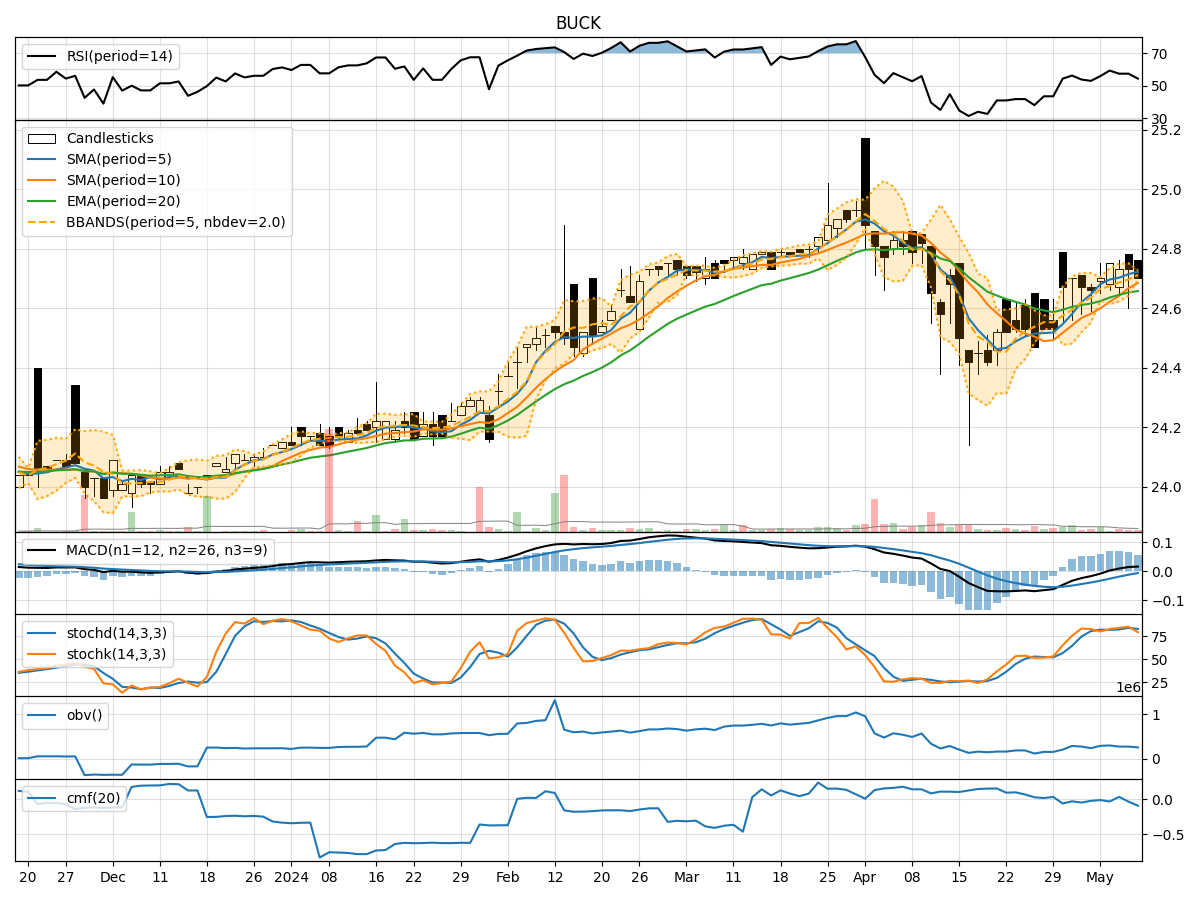
- Moving Averages (MA): The 5-day MA has been consistently above the closing price, indicating a short-term uptrend.
- MACD: The MACD line has been above the signal line, suggesting bullish momentum.
- EMA: The EMA has been trending upwards, supporting the bullish sentiment.
Key Observation: The trend indicators point towards an upward trend in the stock price.
Momentum Analysis:
- RSI: The RSI has been fluctuating around the 50 level, indicating a neutral momentum.
- Stochastic Oscillator: Both %K and %D have been in the overbought zone, signaling potential reversal.
- Williams %R: The indicator has been in the oversold territory, suggesting a possible reversal.
Key Observation: The momentum indicators suggest a potential reversal in the stock price.
Volatility Analysis:
- Bollinger Bands (BB): The stock price has been trading within the bands, indicating stable volatility.
- Bollinger %B: The %B has been fluctuating around the midline, reflecting consolidation.
- Bollinger Band Width: The band width has been narrowing, signaling reduced volatility.
Key Observation: The volatility indicators suggest a consolidation phase in the stock price.
Volume Analysis:
- On-Balance Volume (OBV): The OBV has been fluctuating, indicating indecision among investors.
- Chaikin Money Flow (CMF): The CMF has been negative, suggesting selling pressure.
Key Observation: The volume indicators reflect mixed sentiment among investors.
Conclusion:
Based on the analysis of trend, momentum, volatility, and volume indicators, the next few days' possible stock price movement for BUCK is likely to be sideways with a potential for a reversal. Investors should closely monitor the momentum indicators for any signs of a trend reversal and consider the stable volatility indicated by the Bollinger Bands. It is essential to exercise caution and wait for clearer signals before making significant trading decisions.
In summary, the stock is currently in a consolidation phase with mixed momentum and volume signals, indicating a period of indecision among market participants. Traders should remain vigilant and wait for a clearer direction to emerge before taking substantial positions.
Key Conclusion:
The stock is likely to trade sideways in the near term with a potential for a reversal based on the technical indicators analyzed.