Technical Analysis of BUFB 2024-05-10
Overview:
In analyzing the technical indicators for BUFB stock over the last 5 days, we will delve into the trend, momentum, volatility, and volume indicators to provide a comprehensive outlook on the possible stock price movement in the coming days.
Trend Analysis:
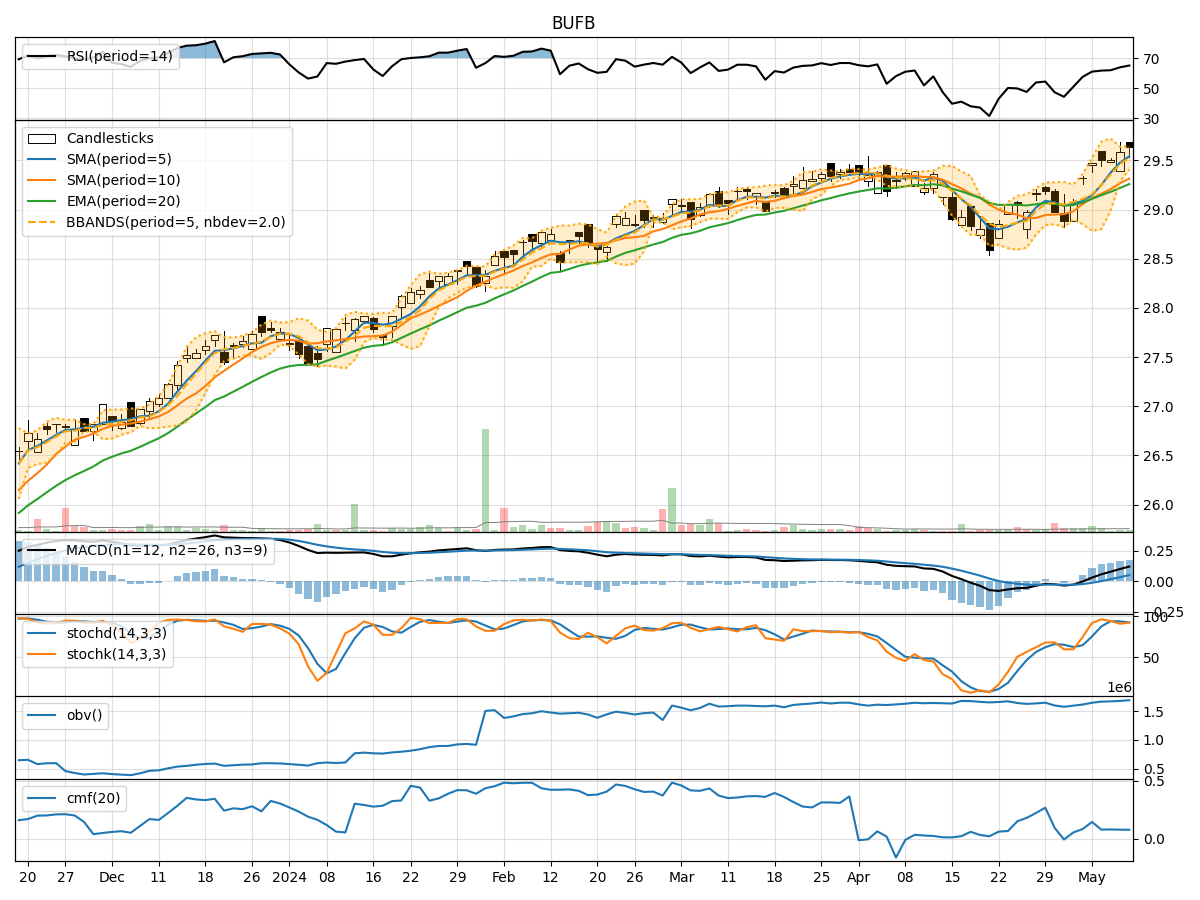
- Moving Averages (MA): The 5-day Moving Average (MA) has been consistently above the Simple Moving Average (SMA) and Exponential Moving Average (EMA), indicating a bullish trend.
- MACD: The MACD line has been consistently above the signal line, with both lines showing an upward trend, suggesting bullish momentum.
Momentum Analysis:
- RSI: The Relative Strength Index (RSI) has been gradually increasing and is currently in the overbought territory, indicating strong buying momentum.
- Stochastic Oscillator: Both %K and %D lines of the Stochastic Oscillator are in the overbought zone, suggesting a potential reversal or consolidation.
Volatility Analysis:
- Bollinger Bands (BB): The stock price has been trading within the upper Bollinger Band (BBU), indicating high volatility and a potential overbought condition.
Volume Analysis:
- On-Balance Volume (OBV): The OBV has been steadily increasing over the last 5 days, indicating strong buying pressure.
- Chaikin Money Flow (CMF): The CMF has been positive but slightly declining, suggesting a potential decrease in buying pressure.
Key Observations:
- The trend indicators suggest a strong bullish sentiment in the short term.
- Momentum indicators indicate overbought conditions, signaling a potential reversal or consolidation.
- Volatility remains high, indicating potential price swings.
- Volume indicators show increasing buying pressure but with a slight decline in momentum.
Conclusion:
Based on the analysis of the technical indicators, the next few days' possible stock price movement for BUFB is likely to experience a short-term pullback or consolidation due to the overbought conditions indicated by the momentum indicators. However, the overall trend remains bullish, so any pullback may present a buying opportunity for traders looking to capitalize on the upward momentum. Exercise caution and consider waiting for a potential dip before entering a long position.