Technical Analysis of BUFC 2024-05-10
Overview:
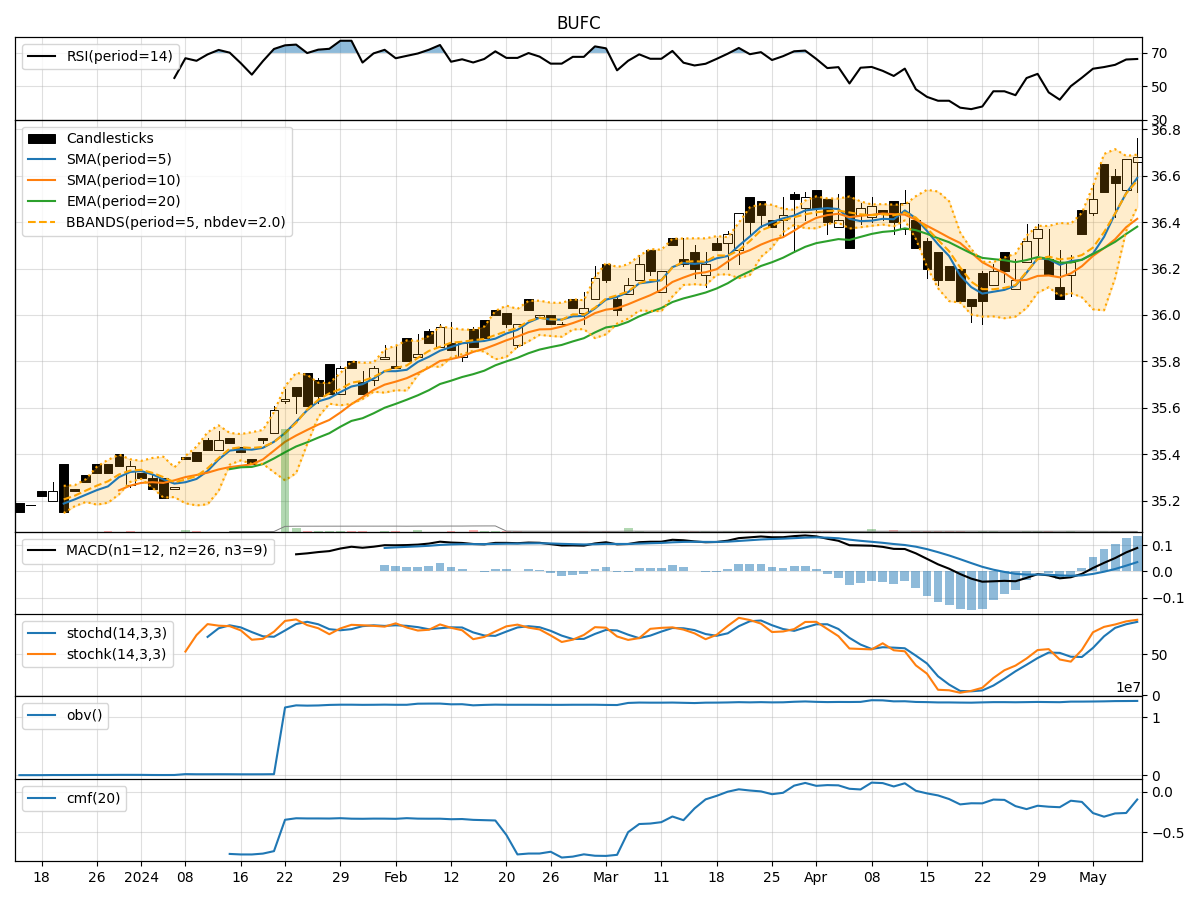
In analyzing the technical indicators for BUFC over the last 5 days, we will delve into the trend, momentum, volatility, and volume indicators to provide a comprehensive outlook on the possible stock price movement in the coming days. By examining these key aspects, we aim to offer valuable insights and predictions to guide your investment decisions.
Trend Analysis:
- Moving Averages (MA): The 5-day Moving Average (MA) has been consistently above the Simple Moving Average (SMA) and Exponential Moving Average (EMA), indicating a bullish trend.
- MACD: The MACD line has been above the signal line, with both showing an upward trend, suggesting positive momentum in the stock price.
Momentum Analysis:
- RSI: The Relative Strength Index (RSI) has been gradually increasing and is currently in the overbought territory, signaling potential strength in the stock.
- Stochastic Oscillator: Both %K and %D lines of the Stochastic Oscillator are in the overbought zone, indicating a strong bullish momentum.
Volatility Analysis:
- Bollinger Bands (BB): The stock price has been trading within the upper Bollinger Band (BBU), suggesting an increased volatility and potential for a price breakout.
Volume Analysis:
- On-Balance Volume (OBV): The OBV indicator has been steadily increasing, indicating accumulation of the stock by investors.
- Chaikin Money Flow (CMF): The CMF has been negative, suggesting some selling pressure in the stock.
Key Observations:
- The trend indicators show a strong bullish sentiment with moving averages and MACD supporting an upward price movement.
- Momentum indicators like RSI and Stochastic Oscillator indicate an overbought condition, signaling a potential correction or consolidation.
- Volatility indicators suggest an increased price fluctuation, possibly leading to a breakout.
- Volume indicators show mixed signals with OBV indicating accumulation but CMF reflecting selling pressure.
Conclusion:
Based on the analysis of technical indicators, the next few days' possible stock price movement for BUFC is likely to be upward in the short term due to the strong bullish trend and positive momentum signals. However, caution is advised as the stock is currently in the overbought territory, indicating a potential correction or consolidation. Traders should closely monitor the price action around the upper Bollinger Band for a possible breakout, while keeping an eye on volume dynamics for confirmation of the trend.