Technical Analysis of BUFG 2024-05-10
Overview:
In analyzing the technical indicators for BUFG stock over the last 5 days, we will delve into the trend, momentum, volatility, and volume indicators to provide a comprehensive outlook on the possible future stock price movement. By examining these key indicators, we aim to offer valuable insights and predictions for the upcoming trading days.
Trend Analysis:
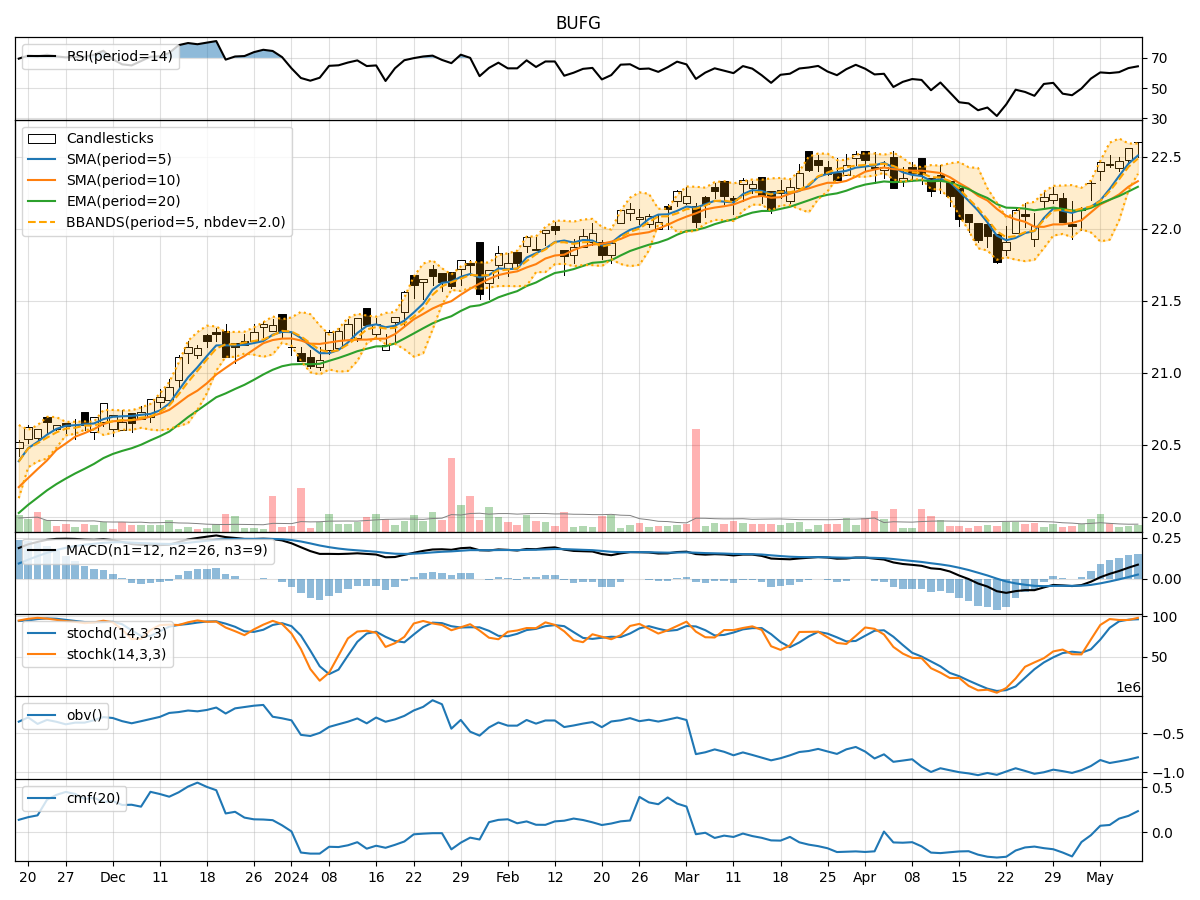
- Moving Averages (MA): The 5-day Moving Average (MA) has been consistently above the Simple Moving Average (SMA) and Exponential Moving Average (EMA), indicating a bullish trend.
- MACD: The MACD line has been consistently above the signal line, with positive values, suggesting a bullish momentum.
Key Observation: The trend indicators point towards a bullish sentiment in the stock price movement.
Momentum Analysis:
- RSI: The Relative Strength Index (RSI) has been trending upwards, indicating increasing buying pressure.
- Stochastic Oscillator: Both %K and %D values have been in the overbought zone, suggesting a strong bullish momentum.
- Williams %R: The Williams %R is consistently at or near the oversold level, indicating a potential reversal.
Key Observation: Momentum indicators signal a strong bullish sentiment in the stock.
Volatility Analysis:
- Bollinger Bands (BB): The stock price has been trading within the Bollinger Bands, with the bands narrowing, indicating decreasing volatility.
Key Observation: Volatility indicators suggest a consolidation phase in the stock price.
Volume Analysis:
- On-Balance Volume (OBV): The OBV has been declining, indicating a decrease in buying pressure.
- Chaikin Money Flow (CMF): The CMF has been positive, suggesting a bullish money flow into the stock.
Key Observation: Volume indicators show a mixed sentiment, with OBV declining but CMF remaining positive.
Conclusion:
Based on the analysis of trend, momentum, volatility, and volume indicators, the overall outlook for BUFG stock in the next few days is bullish. The trend indicators, momentum signals, and positive money flow suggest a continued upward movement in the stock price. However, the narrowing Bollinger Bands and declining OBV raise some caution regarding potential consolidation or a minor pullback.
Recommendation:
Considering the bullish sentiment in the trend and momentum indicators, investors may consider buying or holding positions in BUFG stock for potential upside gains. It is essential to monitor the price action closely for any signs of reversal or increased volatility. Additionally, setting stop-loss orders to manage risk is advisable in this scenario.
By combining technical analysis with market insights, investors can make informed decisions to capitalize on potential opportunities in the stock market.