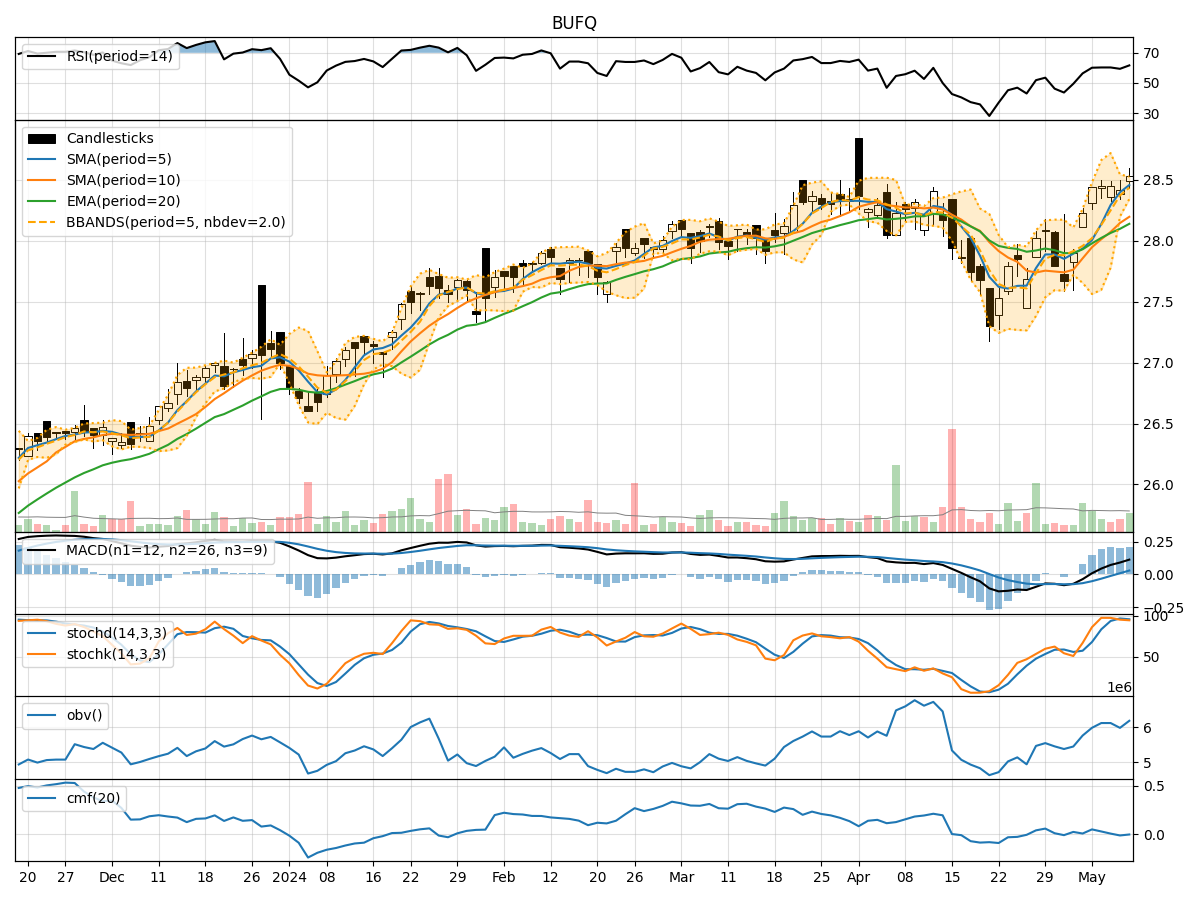
Technical Analysis of BUFQ 2024-05-10
Overview:
In analyzing the technical indicators for BUFQ over the last 5 days, we will delve into the trend, momentum, volatility, and volume indicators to provide a comprehensive outlook on the possible stock price movement. By examining these key aspects, we aim to offer valuable insights and predictions for the upcoming days.
Trend Analysis:
- Moving Averages (MA): The 5-day Moving Average (MA) has been consistently above the Simple Moving Average (SMA) and Exponential Moving Average (EMA), indicating a bullish trend.
- MACD: The MACD line has been consistently above the signal line, with positive values, suggesting bullish momentum.
- Momentum: The Relative Strength Index (RSI) has been fluctuating around the 60 level, indicating moderate momentum.
Momentum Analysis:
- RSI: The RSI has been hovering around the neutral level of 50, suggesting a balanced momentum.
- Stochastic Oscillator: The Stochastic indicators have shown overbought conditions, hinting at a potential reversal.
- Williams %R: The Williams %R has been in the oversold territory, signaling a possible buying opportunity.
Volatility Analysis:
- Bollinger Bands (BB): The stock price has been trading within the Bollinger Bands, with the bands narrowing, indicating decreasing volatility.
- Bollinger %B: The %B indicator has been fluctuating around 1, suggesting the price is close to the upper band.
Volume Analysis:
- On-Balance Volume (OBV): The OBV has shown mixed signals, with no clear trend in volume accumulation.
- Chaikin Money Flow (CMF): The CMF has been positive but decreasing, indicating a potential decrease in buying pressure.
Conclusion:
Based on the analysis of the technical indicators, the stock of BUFQ is likely to experience sideways movement in the next few days. The trend indicators suggest a bullish bias, supported by the MACD and moving averages. However, the momentum indicators show signs of overbought conditions, which could lead to a short-term correction. The volatility is decreasing, indicating a potential period of consolidation, while the volume indicators do not provide a clear direction.
In conclusion, while the overall trend is bullish, caution is advised due to the overbought signals in momentum indicators. Traders may consider taking profits or waiting for a pullback before entering new positions. It is essential to monitor the price action closely and consider additional fundamental analysis to make well-informed trading decisions.