Technical Analysis of BUFR 2024-05-10
Overview:
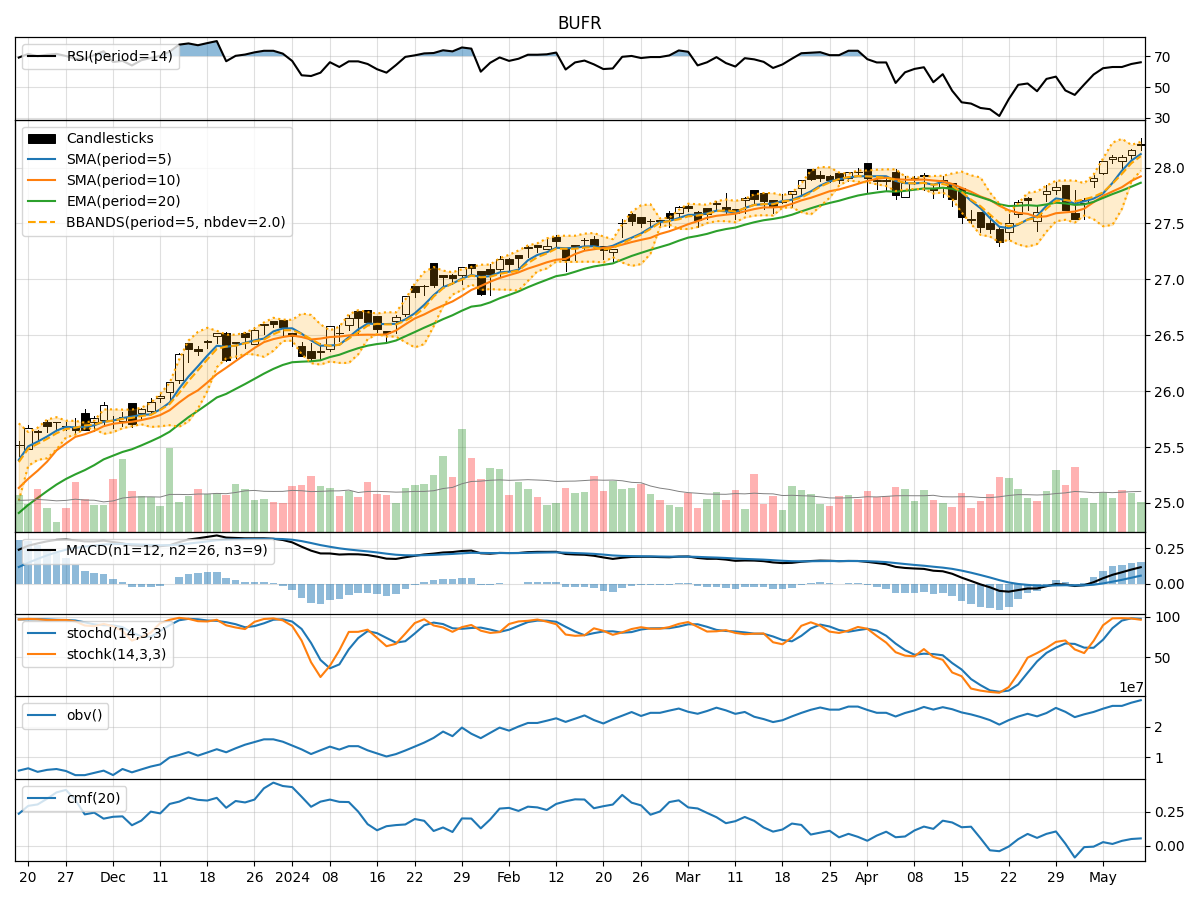
In analyzing the technical indicators for BUFR stock over the last 5 days, we will delve into the trend, momentum, volatility, and volume indicators to provide a comprehensive outlook on the possible stock price movement in the coming days.
Trend Analysis:
- Moving Averages (MA): The 5-day Moving Average (MA) has been consistently above the Simple Moving Average (SMA) and Exponential Moving Average (EMA), indicating a bullish trend.
- MACD: The MACD line has been consistently above the signal line, with both lines showing an upward trend, suggesting bullish momentum.
- Conclusion: The trend indicators point towards an upward trend in the stock price.
Momentum Analysis:
- RSI: The Relative Strength Index (RSI) has been gradually increasing and is currently in the overbought territory, indicating strong buying momentum.
- Stochastic Oscillator: Both %K and %D lines of the Stochastic Oscillator are in the overbought zone, suggesting a potential reversal.
- Conclusion: The momentum indicators signal a potential reversal in the short term due to overbought conditions.
Volatility Analysis:
- Bollinger Bands (BB): The stock price has been trading within the upper Bollinger Band (BBU), indicating high volatility.
- Conclusion: The volatility indicators suggest high volatility in the stock price, which may lead to sharp price movements.
Volume Analysis:
- On-Balance Volume (OBV): The OBV has been steadily increasing over the last 5 days, indicating strong buying pressure.
- Chaikin Money Flow (CMF): The CMF is positive, reflecting buying pressure in the stock.
- Conclusion: The volume indicators suggest strong buying pressure in the stock.
Conclusion:
Based on the analysis of the technical indicators, the stock of BUFR is likely to experience upward price movement in the coming days. The trend indicators support a bullish outlook, while the momentum indicators hint at a potential short-term reversal due to overbought conditions. The high volatility may lead to sharp price movements, but the strong buying pressure indicated by the volume indicators supports the overall bullish view.
Recommendation:
Considering the overall analysis, it is advisable to consider buying BUFR stock for potential short to medium-term gains. However, it is essential to monitor the momentum indicators closely for any signs of a reversal and set appropriate stop-loss levels to manage risk effectively.