Technical Analysis of BUG 2024-05-10
Overview:
In analyzing the technical indicators for the stock of BUG over the last 5 days, we will delve into the trend, momentum, volatility, and volume indicators to provide a comprehensive outlook on the possible stock price movement in the upcoming days. By examining these key indicators, we aim to offer valuable insights and predictions to guide investment decisions.
Trend Analysis:
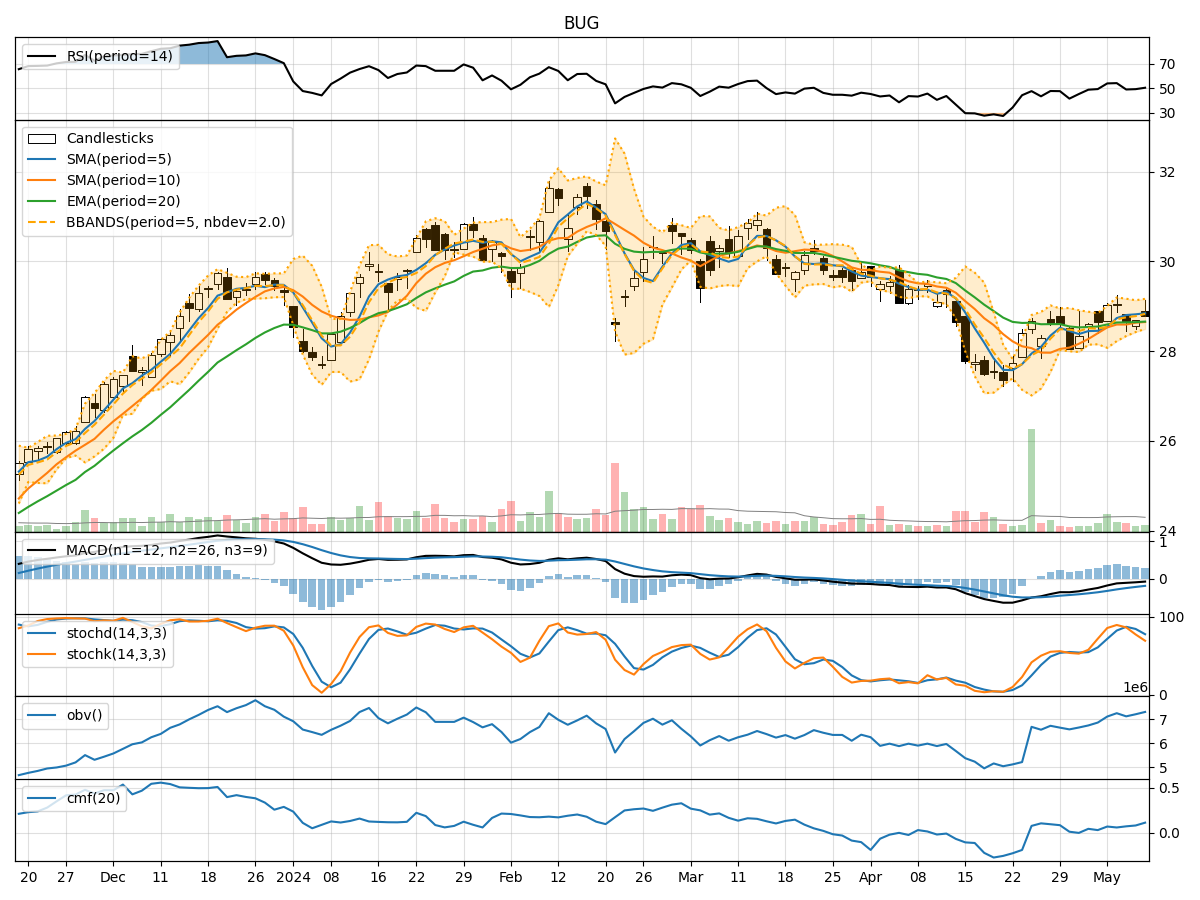
- Moving Averages (MA): The 5-day Moving Average (MA) has been consistently above the Simple Moving Average (SMA) and Exponential Moving Average (EMA), indicating a short-term bullish trend.
- MACD: The Moving Average Convergence Divergence (MACD) has been negative but showing signs of convergence, suggesting a potential reversal in the bearish trend.
- Conclusion: The trend indicators point towards a potential reversal from bearish to bullish in the upcoming days.
Momentum Analysis:
- RSI: The Relative Strength Index (RSI) has been fluctuating around the neutral zone, indicating indecision in the market.
- Stochastic Oscillator: Both %K and %D have been declining, signaling a bearish momentum.
- Conclusion: The momentum indicators suggest a bearish sentiment prevailing in the market.
Volatility Analysis:
- Bollinger Bands (BB): The stock price has been trading within the Bollinger Bands, with the bands narrowing, indicating decreasing volatility.
- Conclusion: Volatility indicators suggest a consolidation phase in the stock price.
Volume Analysis:
- On-Balance Volume (OBV): The OBV has been showing a slight increase, indicating buying pressure in the market.
- Chaikin Money Flow (CMF): The CMF has been positive, suggesting money flow into the stock.
- Conclusion: Volume indicators point towards positive accumulation in the stock.
Overall Conclusion:
Based on the analysis of trend, momentum, volatility, and volume indicators, the following conclusions can be drawn: - Trend: The trend indicators suggest a potential reversal from bearish to bullish. - Momentum: Momentum indicators indicate a bearish sentiment prevailing in the market. - Volatility: Volatility indicators point towards a consolidation phase. - Volume: Volume indicators suggest positive accumulation in the stock.
Final Prediction:
Considering the mixed signals from the technical indicators, it is crucial to approach the next few days with caution. While the trend indicators hint at a potential bullish reversal, the momentum indicators signal bearish sentiment. The volatility indicators suggest a consolidation phase, and the volume indicators indicate positive accumulation. Therefore, the stock price movement in the next few days is likely to be volatile with a potential for a bullish reversal. Traders and investors should closely monitor the price action and key support/resistance levels for better decision-making.