Technical Analysis of BUL 2024-05-10
Overview:
In analyzing the technical indicators for BUL stock over the last 5 days, we will delve into the trend, momentum, volatility, and volume indicators to provide a comprehensive outlook on the possible stock price movement in the coming days. By examining these key indicators, we aim to offer valuable insights and predictions for informed decision-making.
Trend Analysis:
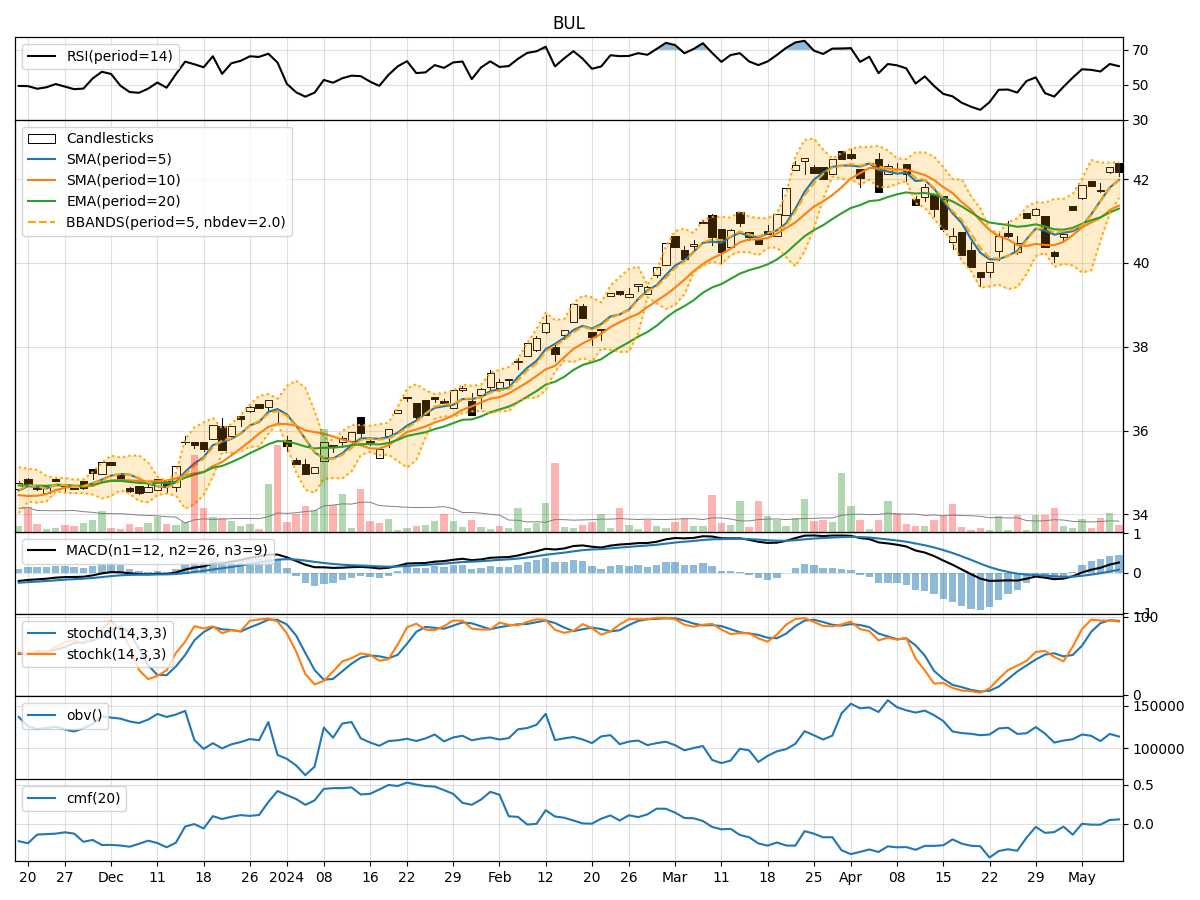
- Moving Averages (MA): The 5-day MA has been consistently above the closing prices, indicating an upward trend.
- MACD: The MACD line has been positive and increasing, suggesting bullish momentum.
- RSI: The RSI has been fluctuating around the 60-70 range, indicating moderate strength in the current trend.
Key Observation: The trend indicators suggest a bullish sentiment in the stock price movement.
Momentum Analysis:
- Stochastic Oscillator: Both %K and %D have been in the overbought zone, signaling potential overvaluation.
- Williams %R: The indicator has been hovering in the oversold territory, indicating a possible reversal.
Key Observation: Momentum indicators show a mixed signal with potential for a pullback in the stock price.
Volatility Analysis:
- Bollinger Bands (BB): The stock price has been trading within the bands, with narrowing volatility.
- Bollinger %B: The %B indicator suggests the stock is currently trading close to the upper band.
Key Observation: Volatility indicators point towards a consolidation phase with a potential for a breakout.
Volume Analysis:
- On-Balance Volume (OBV): The OBV has been fluctuating, indicating indecision among investors.
- Chaikin Money Flow (CMF): The CMF has shown slight positive divergence, suggesting some buying pressure.
Key Observation: Volume indicators reflect mixed sentiment with a slight bullish bias.
Conclusion:
Based on the analysis of trend, momentum, volatility, and volume indicators, the next few days' possible stock price movement for BUL is likely to experience consolidation with a bullish bias. However, considering the overbought levels in momentum indicators and the narrowing volatility, a pullback or correction cannot be ruled out in the short term. Investors should closely monitor key support and resistance levels for potential entry or exit points.
Recommendation:
- Short-term Traders: Consider taking profits or setting tight stop-loss orders due to potential overbought conditions.
- Long-term Investors: Hold positions with a watchful eye on key technical levels for potential buying opportunities during pullbacks.
In conclusion, while the overall trend remains bullish, caution is advised due to the mixed signals from momentum and volume indicators. Stay vigilant and adapt your strategy accordingly to navigate potential market fluctuations.