Technical Analysis of BULZ 2024-05-10
Overview:
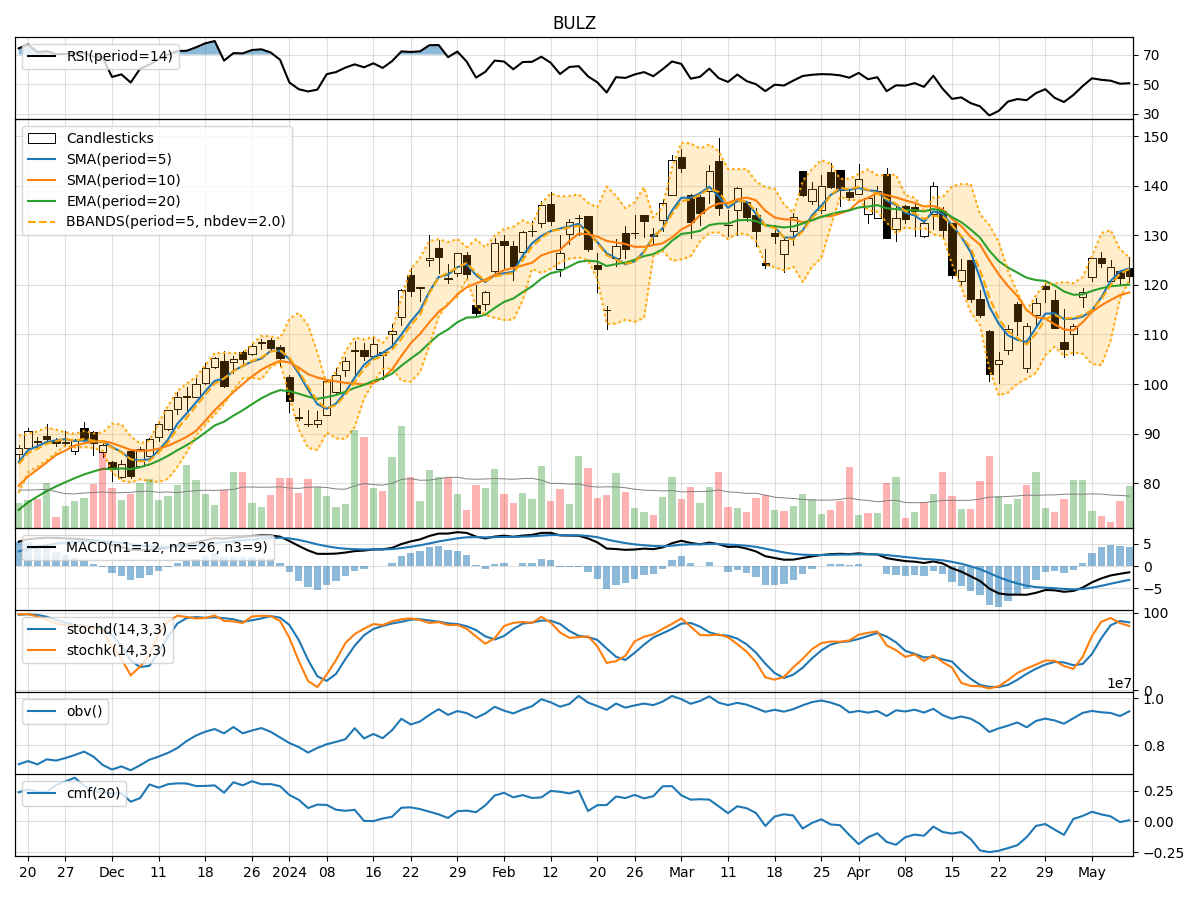
In analyzing the technical indicators for BULZ stock over the last 5 days, we will delve into the trends, momentum, volatility, and volume indicators to provide a comprehensive outlook on the possible stock price movement in the coming days.
Trend Indicators:
- Moving Averages (MA): The 5-day MA has been consistently above the longer-term SMAs and EMAs, indicating a short-term bullish trend.
- MACD: The MACD line has been decreasing but remains above the signal line, suggesting a potential reversal in the short term.
- MACD Histogram: The histogram has been decreasing, indicating a weakening bullish momentum.
Momentum Indicators:
- RSI: The RSI has been fluctuating around the 50 level, indicating a lack of strong momentum in either direction.
- Stochastic Oscillator: Both %K and %D have been declining, signaling a potential bearish momentum.
- Williams %R: The indicator has been in oversold territory, suggesting a possible reversal to the upside.
Volatility Indicators:
- Bollinger Bands: The stock price has been trading within the bands, with the %B indicator showing a slight decrease in volatility.
- Average True Range (ATR): The ATR has been relatively stable, indicating consistent price movement.
Volume Indicators:
- On-Balance Volume (OBV): The OBV has been declining, indicating selling pressure in the stock.
- Chaikin Money Flow (CMF): The CMF has been positive but decreasing, suggesting a potential outflow of money from the stock.
Key Observations and Opinions:
- Trend: The short-term trend is bullish, but the weakening MACD and MACD Histogram signal a potential reversal.
- Momentum: The RSI and Stochastic Oscillator indicate a lack of strong momentum, with a possibility of a bearish turn.
- Volatility: The stock has been trading within a relatively stable range, with a slight decrease in volatility.
- Volume: The declining OBV and decreasing CMF suggest a shift towards selling pressure and potential outflows.
Conclusion:
Based on the analysis of the technical indicators, the stock is showing signs of potential consolidation in the coming days. The weakening momentum, coupled with the bearish signals from the MACD and volume indicators, may lead to a period of sideways movement. Caution is advised for traders and investors as the stock may experience a period of indecision before establishing a clear trend.