Technical Analysis of BUSA 2024-05-10
Overview:
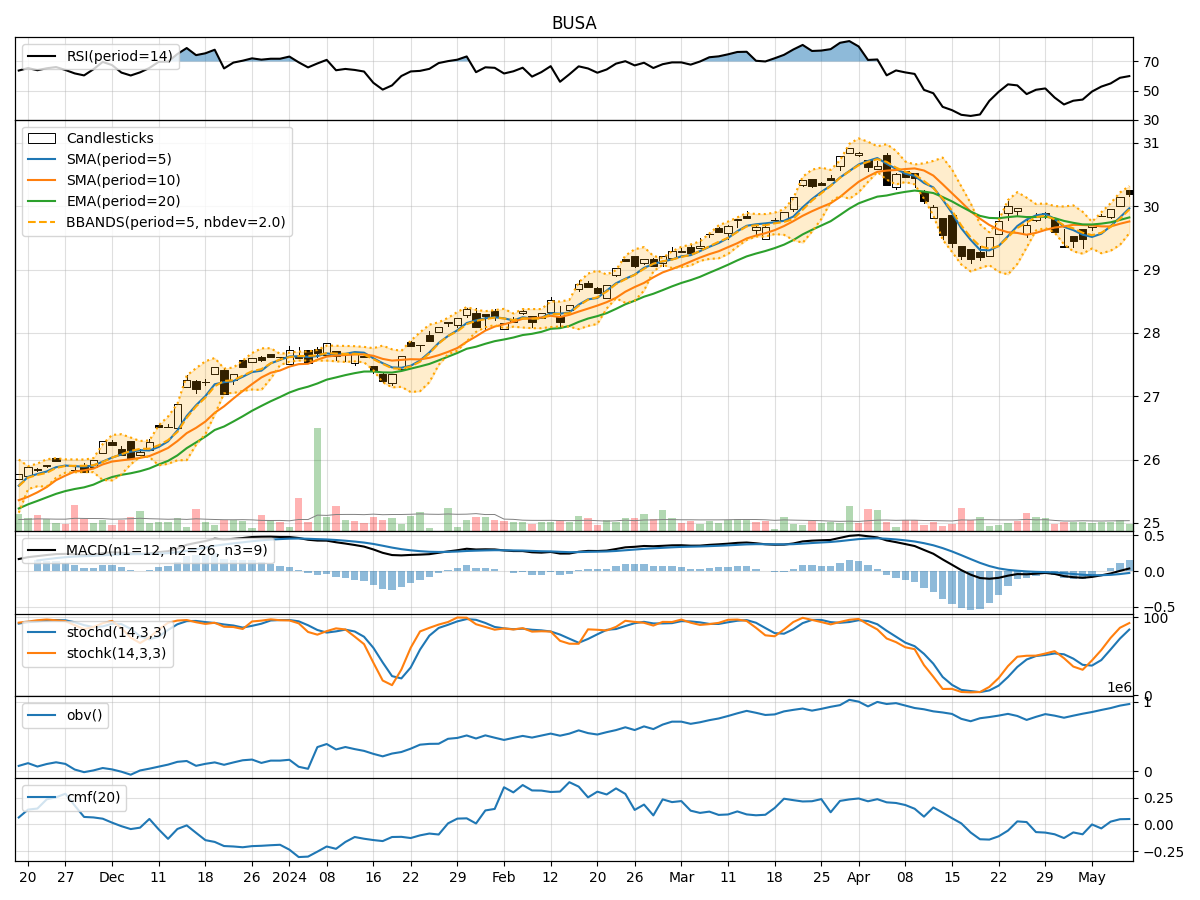
In analyzing the technical indicators for BUSA stock over the last 5 days, we will delve into the trend, momentum, volatility, and volume indicators to provide a comprehensive outlook on the possible stock price movement in the coming days.
Trend Analysis:
- Moving Averages (MA): The 5-day Moving Average (MA) has been trending upwards, indicating a positive momentum in the stock price.
- MACD: The MACD line has been consistently above the signal line, suggesting a bullish trend.
- EMA: The Exponential Moving Average (EMA) has been steadily increasing, supporting the bullish sentiment in the stock.
Momentum Analysis:
- RSI: The Relative Strength Index (RSI) has been gradually increasing, indicating strengthening momentum in the stock.
- Stochastic Oscillator: Both %K and %D values have been rising, signifying increasing buying pressure.
- Williams %R: The Williams %R is moving towards the oversold region, suggesting a potential reversal in the stock price.
Volatility Analysis:
- Bollinger Bands: The Bollinger Bands are widening, indicating increased volatility in the stock price.
- Bollinger %B: The %B value is relatively low, suggesting the stock is trading closer to the lower band, potentially indicating an oversold condition.
Volume Analysis:
- On-Balance Volume (OBV): The OBV has been steadily increasing, reflecting strong buying volume in the stock.
- Chaikin Money Flow (CMF): The CMF has been positive, indicating that money is flowing into the stock.
Key Observations:
- The trend indicators suggest a bullish sentiment with moving averages and MACD supporting an upward trend.
- Momentum indicators show increasing buying pressure and potential for a price reversal.
- Volatility indicators point towards increased price fluctuations.
- Volume indicators indicate strong buying volume and positive money flow into the stock.
Conclusion:
Based on the analysis of the technical indicators, the stock is likely to continue its upward momentum in the coming days. The bullish trend supported by moving averages, MACD, RSI, and increasing buying pressure from stochastic indicators suggests a positive outlook. However, the widening Bollinger Bands and nearing oversold condition in Williams %R indicate potential short-term volatility and a minor pullback before resuming the upward trend. Overall, the stock is poised for further upside movement in the near future.