Technical Analysis of BUYZ 2024-05-10
Overview:
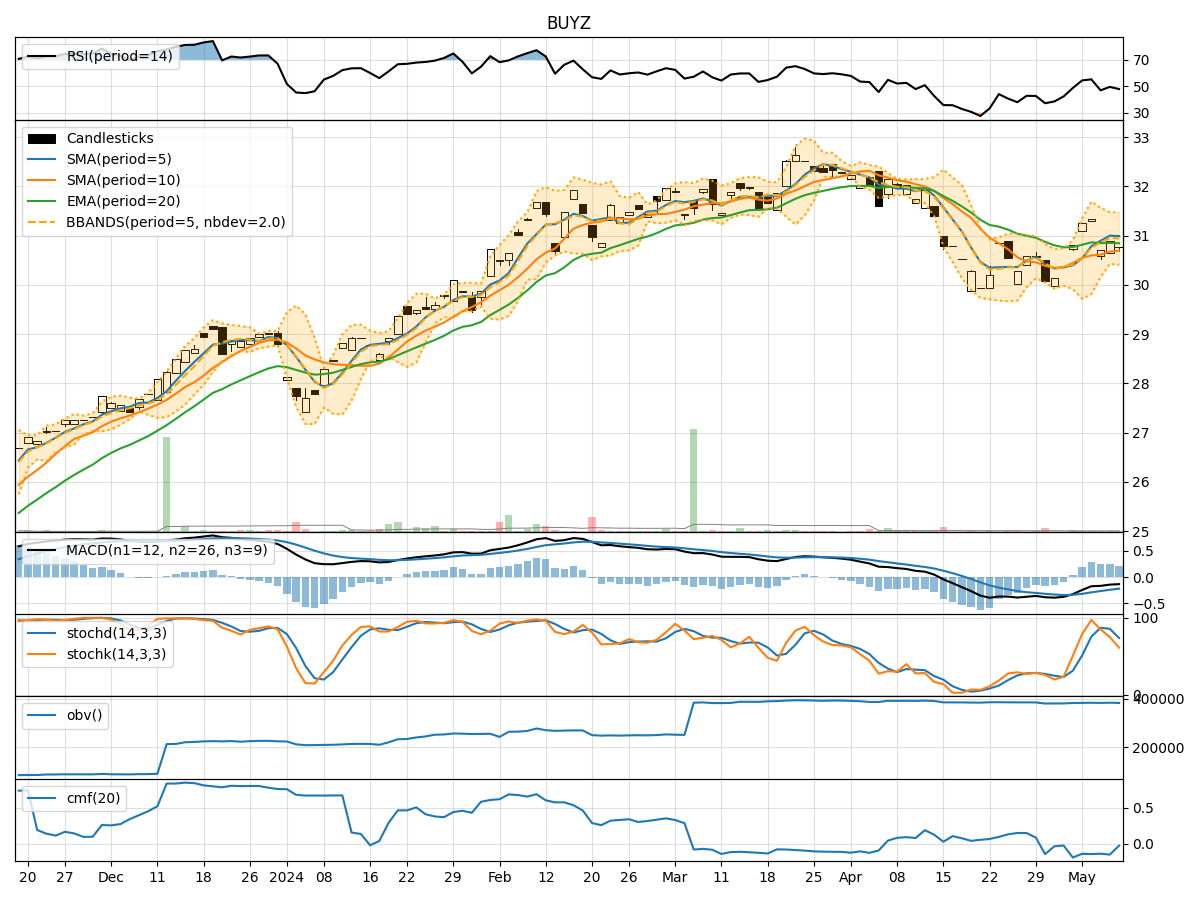
In analyzing the technical indicators for BUYZ over the last 5 days, we will delve into the trend, momentum, volatility, and volume indicators to provide a comprehensive outlook on the possible stock price movement in the coming days. By examining these key aspects, we aim to offer valuable insights and recommendations for potential investors.
Trend Analysis:
- Moving Averages (MA): The 5-day Moving Average (MA) has been fluctuating around the Simple Moving Average (SMA) and Exponential Moving Average (EMA) values, indicating a lack of clear trend direction.
- MACD: The Moving Average Convergence Divergence (MACD) has been consistently negative, suggesting a bearish momentum in the short term.
- MACD Histogram: The MACD Histogram has shown slight positive values, indicating a potential reversal in the bearish momentum.
Momentum Analysis:
- RSI: The Relative Strength Index (RSI) has been hovering around the neutral zone, indicating a balanced momentum between buying and selling pressure.
- Stochastic Oscillator: Both %K and %D values have been declining, signaling a potential bearish momentum.
- Williams %R: The Williams %R indicator has been in the oversold territory, suggesting a possible reversal in the near future.
Volatility Analysis:
- Bollinger Bands (BB): The Bollinger Bands have been narrowing, indicating decreasing volatility in the stock price.
- Bollinger %B: The %B value has been relatively low, suggesting a potential buying opportunity as the stock price approaches the lower band.
Volume Analysis:
- On-Balance Volume (OBV): The OBV indicator has shown mixed movements, reflecting indecision among market participants.
- Chaikin Money Flow (CMF): The CMF has been negative, indicating a lack of buying pressure in the stock.
Key Observations and Opinions:
- Trend: The trend indicators suggest a lack of clear direction, with a slight potential for a bullish reversal based on the MACD Histogram.
- Momentum: Momentum indicators point towards a bearish sentiment, especially with the Stochastic Oscillator in the oversold region.
- Volatility: Volatility has been decreasing, potentially leading to a period of consolidation or a breakout in the near future.
- Volume: Volume indicators reflect mixed signals, indicating uncertainty in market participation.
Conclusion:
Based on the analysis of the technical indicators, the stock price of BUYZ is likely to experience sideways movement in the coming days, with a potential for a bullish reversal based on the MACD Histogram. However, the overall sentiment remains bearish due to the negative momentum indicators and lack of strong buying pressure reflected in the volume indicators. Investors should closely monitor the price action for any signs of a definitive trend change before making investment decisions.