Technical Analysis of BUZZ 2024-05-10
Overview:
In analyzing the technical indicators for the stock BUZZ over the last 5 days, we will delve into the trend, momentum, volatility, and volume indicators to provide a comprehensive outlook on the possible stock price movement in the coming days. By examining these key indicators, we aim to offer valuable insights and predictions for potential investors.
Trend Indicators:
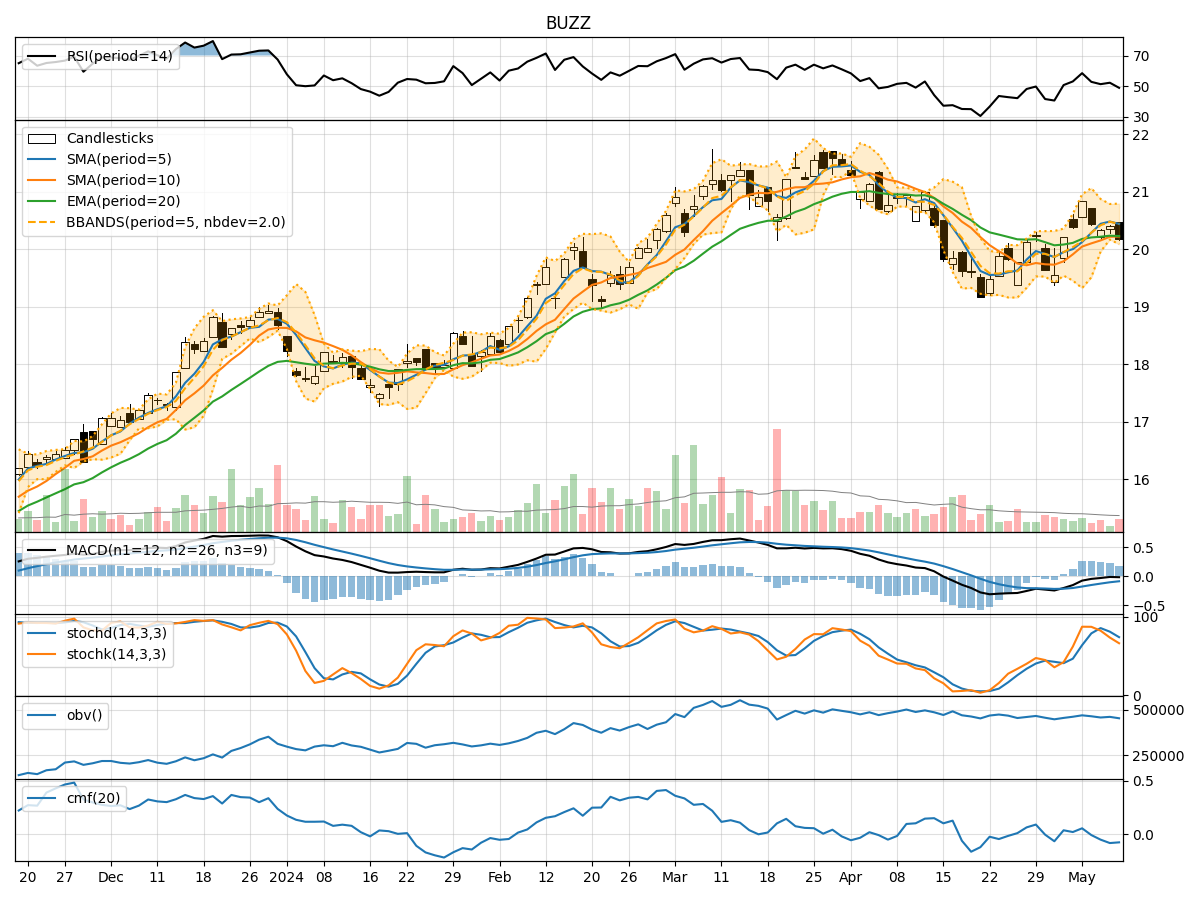
- Moving Averages (MA): The 5-day Moving Average (MA) has been fluctuating around the closing prices, indicating short-term price trends. The Simple Moving Average (SMA) and Exponential Moving Average (EMA) have shown slight variations but have not diverged significantly.
- MACD: The Moving Average Convergence Divergence (MACD) has been negative, suggesting a bearish momentum in the stock price. The MACD Histogram (MACDH) has been positive but decreasing, indicating a potential reversal in the bearish trend.
Momentum Indicators:
- RSI: The Relative Strength Index (RSI) has been hovering around the neutral zone, indicating a lack of strong momentum in either direction.
- Stochastic Oscillator: Both %K and %D of the Stochastic Oscillator have been declining, signaling a potential bearish momentum in the stock.
- Williams %R: The Williams %R has been in the oversold territory, suggesting a possible reversal or consolidation phase.
Volatility Indicators:
- Bollinger Bands (BB): The Bollinger Bands have been narrowing, indicating decreasing volatility in the stock price. The bands are relatively close to each other, suggesting a potential breakout or significant price movement.
- Bollinger %B: The %B indicator has been decreasing, indicating that the stock price is currently trading closer to the lower band, potentially signaling an oversold condition.
Volume Indicators:
- On-Balance Volume (OBV): The OBV has been declining, indicating that selling pressure has been dominant in the stock. This could potentially lead to further downward price movement.
- Chaikin Money Flow (CMF): The CMF has been negative, suggesting that money flow has been out of the stock over the past 20 days, indicating bearish sentiment.
Conclusion:
Based on the analysis of the technical indicators, the stock BUZZ is currently exhibiting bearish signals across multiple indicators. The trend indicators show a potential reversal in the bearish trend, while momentum indicators suggest a lack of strong buying interest. Volatility indicators point towards a potential breakout or significant price movement, while volume indicators indicate a dominant selling pressure.
Therefore, the next few days' possible stock price movement for BUZZ is likely to be downward, with a potential for further decline in the stock price. Investors should exercise caution and consider waiting for more positive signals before considering any long positions in the stock.