Technical Analysis of BWET 2024-05-10
Overview:
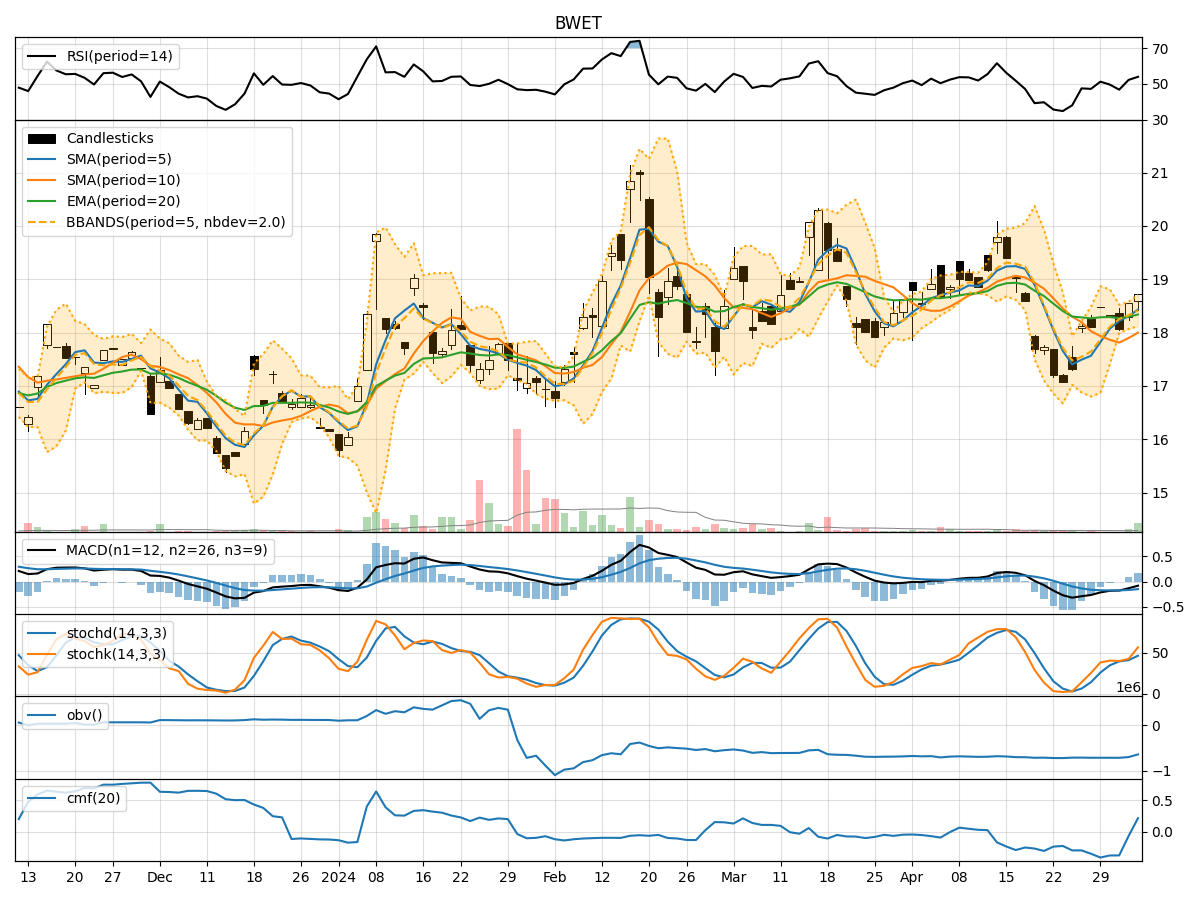
In analyzing the technical indicators for BWET over the last 5 days, we will delve into the trend, momentum, volatility, and volume indicators to provide a comprehensive outlook on the possible stock price movement. By examining these key aspects, we aim to offer valuable insights and predictions for the upcoming days.
Trend Analysis:
- Moving Averages (MA): The 5-day Moving Average (MA) has been consistently above the Simple Moving Average (SMA) and Exponential Moving Average (EMA), indicating a bullish trend.
- MACD: The MACD line has been consistently above the signal line, with the MACD Histogram showing positive values, suggesting a bullish momentum.
Momentum Analysis:
- RSI: The Relative Strength Index (RSI) has been gradually increasing and is currently in the neutral zone, indicating potential room for further upside.
- Stochastic Oscillator: Both %K and %D have been in the overbought territory, suggesting a strong bullish momentum.
- Williams %R: The Williams %R is in the oversold region, indicating a potential reversal or consolidation.
Volatility Analysis:
- Bollinger Bands (BB): The stock price has been trading within the Bollinger Bands, with the bands widening slightly, indicating increased volatility.
- Bollinger %B: The %B indicator is hovering around the middle range, suggesting a balanced market sentiment.
Volume Analysis:
- On-Balance Volume (OBV): The OBV has been steadily increasing, indicating strong buying pressure and accumulation of the stock.
- Chaikin Money Flow (CMF): The CMF is positive and rising, reflecting a bullish money flow into the stock.
Key Observations:
- The trend indicators suggest a strong bullish sentiment, supported by the moving averages and MACD.
- Momentum indicators indicate a mix of overbought and oversold conditions, signaling a potential consolidation or reversal.
- Volatility has slightly increased, but the %B indicator shows a balanced market sentiment.
- Volume indicators point towards strong buying pressure and positive money flow into the stock.
Conclusion:
Based on the analysis of the technical indicators, the next few days for BWET are likely to see continued upward movement in the stock price. The bullish trend supported by moving averages and MACD, along with strong buying pressure indicated by volume indicators, suggests a positive outlook. However, the overbought conditions in the momentum indicators may lead to a short-term consolidation or pullback before the uptrend resumes. Overall, the stock is bullish in the near term, with potential for further upside.