Technical Analysis of BWTG 2024-05-10
Overview:
In analyzing the technical indicators for BWTG over the last 5 days, we will delve into the trend, momentum, volatility, and volume indicators to provide a comprehensive outlook on the possible stock price movement in the coming days. By examining these key indicators, we aim to offer valuable insights and predictions for potential investors.
Trend Analysis:
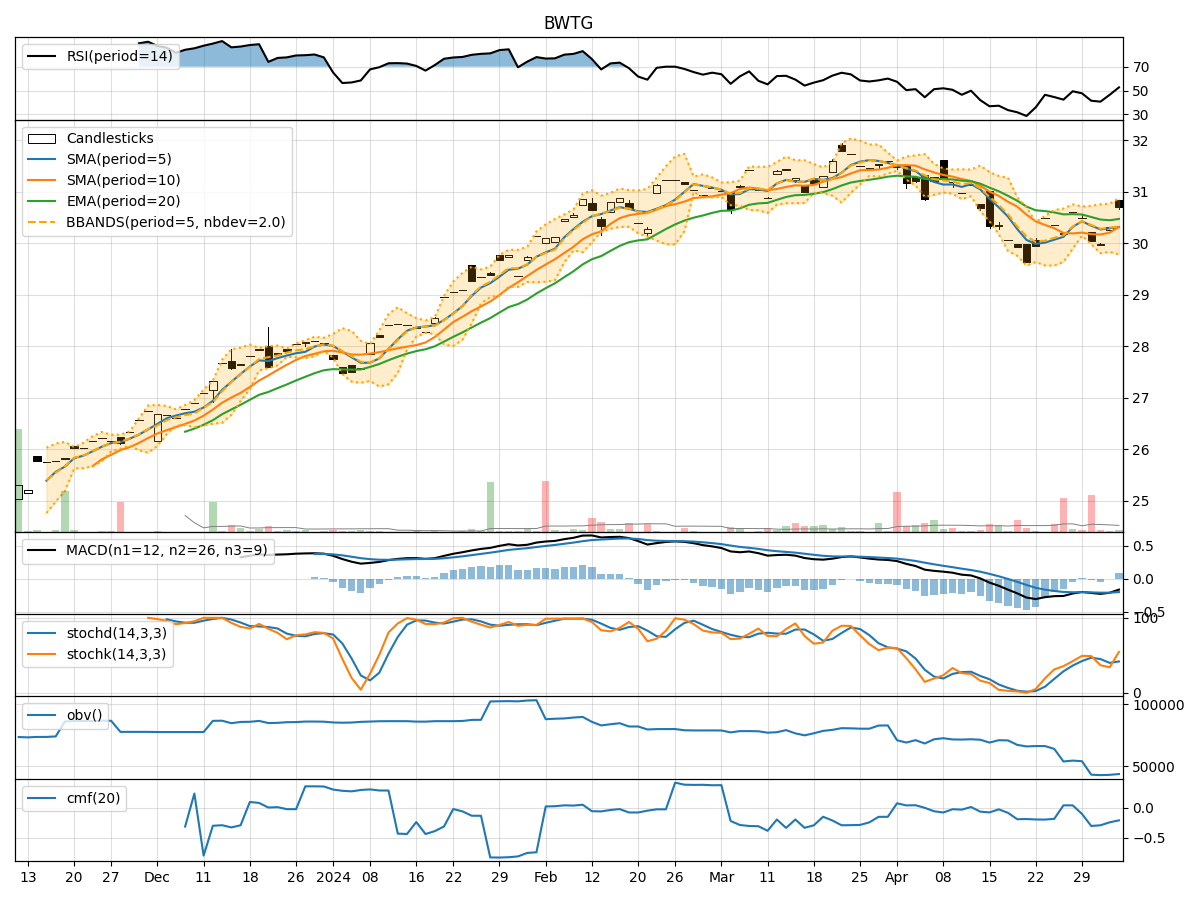
- Moving Averages (MA): The 5-day Moving Average (MA) has been consistently above the Simple Moving Average (SMA) and Exponential Moving Average (EMA), indicating a bullish trend.
- MACD: The MACD line has been consistently above the signal line, with both lines showing an upward trend, suggesting bullish momentum.
Momentum Analysis:
- RSI: The Relative Strength Index (RSI) has been increasing, indicating strengthening momentum.
- Stochastic Oscillator: Both %K and %D have been at or near 100%, signaling strong buying pressure.
Volatility Analysis:
- Bollinger Bands (BB): The stock price has been consistently trading above the middle Bollinger Band (BBM), indicating an upward trend with low volatility.
Volume Analysis:
- On-Balance Volume (OBV): The OBV has been decreasing, suggesting a divergence between price and volume.
- Chaikin Money Flow (CMF): The CMF has been negative, indicating a lack of buying pressure.
Key Observations:
- The trend indicators suggest a strong bullish sentiment, supported by the MACD and moving averages.
- Momentum indicators show increasing buying pressure and positive momentum.
- Volatility remains relatively low, with the stock price trading above the middle Bollinger Band.
- Volume indicators, however, show a divergence with decreasing OBV and negative CMF.
Conclusion:
Based on the analysis of the technical indicators, the overall outlook for BWTG in the next few days is bullish. The trend is upward, momentum is positive, and volatility is low, indicating a potential continuation of the current uptrend. However, the divergence in volume indicators raises a cautionary flag, suggesting that the bullish trend may face some resistance or consolidation in the near term. Investors should closely monitor volume dynamics to confirm the sustainability of the bullish trend.