Technical Analysis of BWX 2024-05-10
Overview:
In analyzing the technical indicators for BWX over the last 5 days, we will delve into the trend, momentum, volatility, and volume indicators to provide a comprehensive outlook on the possible stock price movement in the coming days.
Trend Indicators:
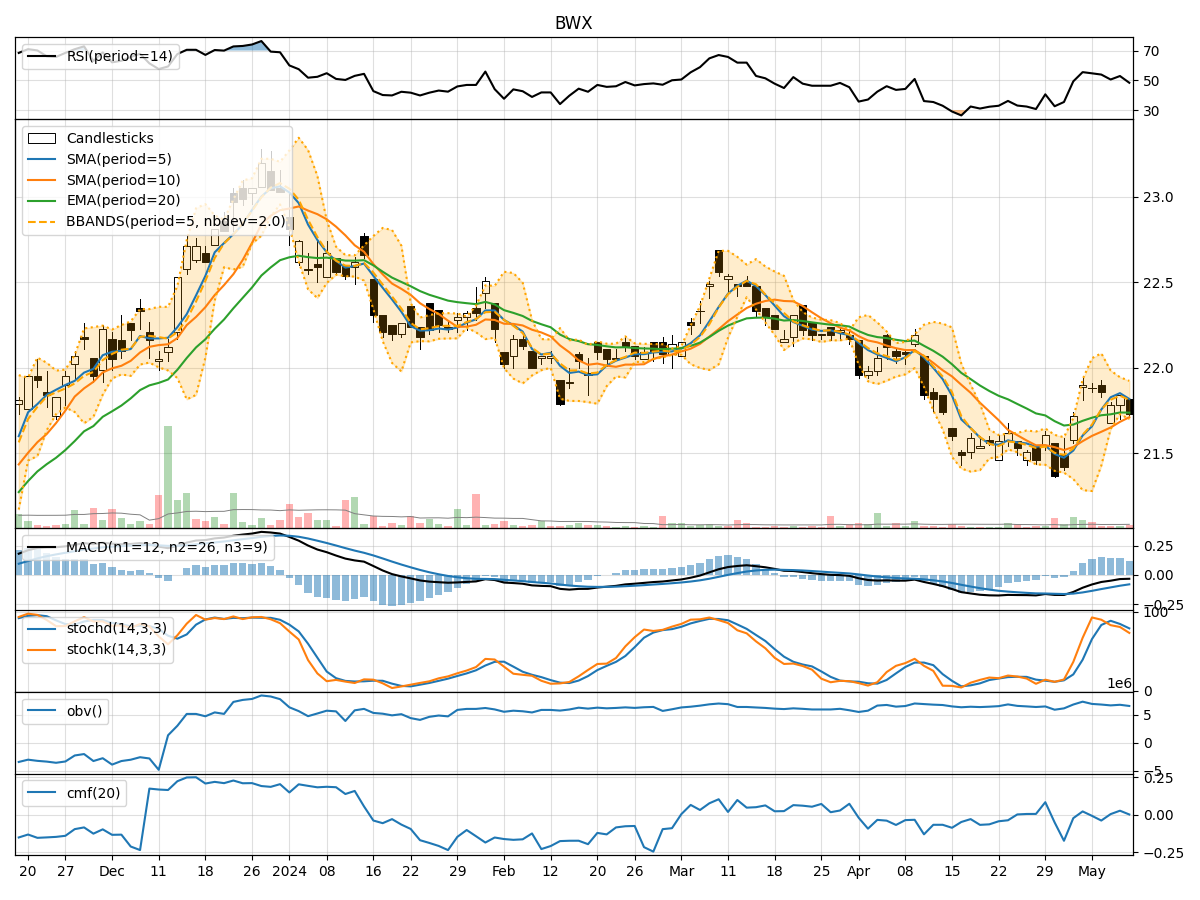
- Moving Averages (MA): The 5-day Moving Average (MA) has been fluctuating around the closing prices, indicating short-term price trends. The Simple Moving Average (SMA) and Exponential Moving Average (EMA) have shown a slight upward trend, albeit with some volatility.
- MACD: The Moving Average Convergence Divergence (MACD) has been negative, suggesting a bearish momentum in the short term. The MACD Histogram (MACDH) has been positive but decreasing, indicating a potential reversal in the bearish trend.
Momentum Indicators:
- RSI: The Relative Strength Index (RSI) has been hovering around the neutral zone, indicating a lack of strong momentum in either direction.
- Stochastic Oscillator: Both %K and %D have been declining, signaling a bearish momentum in the short term.
- Williams %R: The Williams %R has been in the oversold territory, suggesting a potential reversal to the upside.
Volatility Indicators:
- Bollinger Bands: The Bollinger Bands have been narrowing, indicating decreasing volatility in the stock price. The bands are currently close to the price, suggesting a potential breakout in either direction.
- Bollinger %B: The %B indicator has been fluctuating around the middle range, indicating a balanced market sentiment.
Volume Indicators:
- On-Balance Volume (OBV): The OBV has been fluctuating, indicating mixed buying and selling pressure in the stock.
- Chaikin Money Flow (CMF): The CMF has been close to zero, suggesting a neutral money flow in the stock.
Key Observations:
- The trend indicators show a mixed picture with a slight upward bias in moving averages but a bearish signal from the MACD.
- Momentum indicators indicate a lack of strong momentum, with stochastic oscillators signaling a bearish bias.
- Volatility indicators suggest decreasing volatility and a potential breakout in the near future.
- Volume indicators reflect mixed buying and selling pressure with a neutral money flow.
Conclusion:
Based on the analysis of the technical indicators, the stock price of BWX is likely to experience sideways consolidation in the coming days. The lack of strong momentum, mixed trend signals, and decreasing volatility point towards a period of price stabilization. Traders may expect the stock to trade within a range with no clear directional bias. It is advisable to closely monitor the breakout of the Bollinger Bands for potential trend confirmation.